Example data
suppressPackageStartupMessages(library(BoutrosLab.plotting.general));
suppressPackageStartupMessages(library(mgcv));

alpha <- 0.05;
zcrit <- qnorm(1 - alpha / 2);
fit <- gam(
    mpg ~ s(hp),
    data = mtcars
    );

pred.grid <- data.frame(
    hp = seq(50, 300, by = 0.01)
    );
pred <- data.frame(predict(
    object = fit,
    newdata = pred.grid,
    type = 'response',
    se.fit = TRUE
    ));
pred$lower <- pred$fit - zcrit * pred$se.fit;
pred$upper <- pred$fit + zcrit * pred$se.fit;
pred$hp <- pred.grid$hp;
head(pred)
#>        fit   se.fit    lower    upper    hp
#> 1 30.22140 1.511997 27.25794 33.18486 50.00
#> 2 30.21997 1.511678 27.25713 33.18280 50.01
#> 3 30.21854 1.511359 27.25633 33.18075 50.02
#> 4 30.21711 1.511041 27.25552 33.17869 50.03
#> 5 30.21568 1.510722 27.25472 33.17664 50.04
#> 6 30.21425 1.510404 27.25391 33.17458 50.05

xat <- seq(50, 300, by = 50);
yat <- seq(0, 40, by = 10);
col <- default.colours(1);
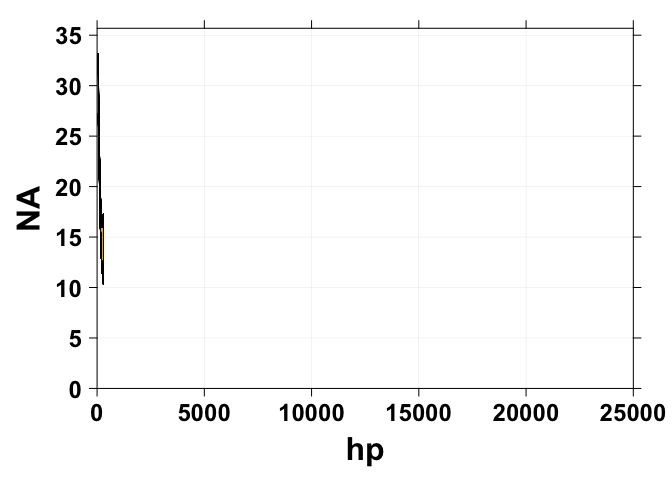
Plot doesnt work for default xat/xlimits/yat/ylimits
create.polygonplot(
    formula = NA ~ hp,
    data = pred,
    min = pred$lower,
    max = pred$upper,
    col = col,
    add.median = TRUE,
    median = pred$est
    );
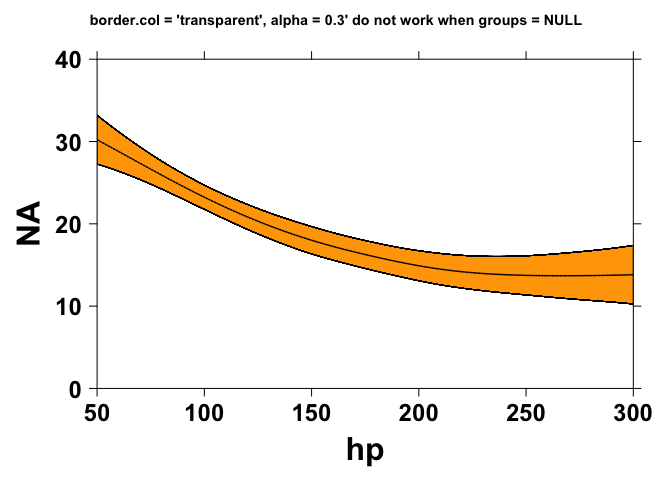
border.col/alpha do not work when groups = NULL
Related to #24
create.polygonplot(
    formula = NA ~ hp,
    data = pred,
    min = pred$lower,
    max = pred$upper,
    ylimits = c(min(yat), max(yat)),
    yat = yat,
    xlimits = c(min(xat), max(xat)),
    xat = xat,
    col = col,
    alpha = 0.3, # doesnt work
    grid.col = 'transparent',
    add.border = TRUE,
    border.col = 'transparent', # doesnt work
    add.median = TRUE,
    median = pred$fit,
    median.col = 'black',
    main = 'border.col = \'transparent\', alpha = 0.3\' do not work when groups = NULL',
    main.cex = 0.9
    );
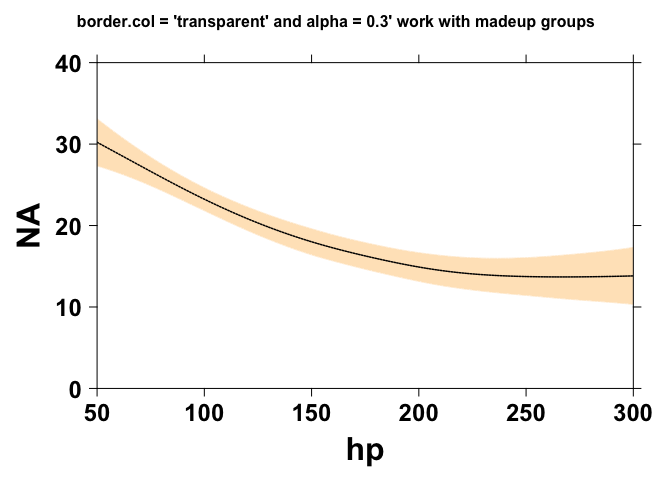
Solution
For now, the solution is to provide a madeup constant group variable:
create.polygonplot(
    formula = NA ~ hp,
    data = pred,
    min = pred$lower,
    max = pred$upper,
    ylimits = c(min(yat), max(yat)),
    yat = yat,
    xlimits = c(min(xat), max(xat)),
    xat = xat,
    col = col,
    alpha = 0.3, # doesnt work
    grid.col = 'transparent',
    add.border = TRUE,
    border.col = 'transparent',
    add.median = TRUE,
    median = pred$fit,
    median.col = 'black',
    main = 'border.col = \'transparent\' and alpha = 0.3\' work with madeup groups',
    main.cex = 1,
    groups = rep(1, nrow(pred)) # madeup constant groups
    );
Created on 2025-08-05 with reprex v2.1.1
Example data
Plot doesnt work for default
xat/xlimits/yat/ylimitscreate.polygonplot( formula = NA ~ hp, data = pred, min = pred$lower, max = pred$upper, col = col, add.median = TRUE, median = pred$est );border.col/alphado not work whengroups = NULLRelated to #24
create.polygonplot( formula = NA ~ hp, data = pred, min = pred$lower, max = pred$upper, ylimits = c(min(yat), max(yat)), yat = yat, xlimits = c(min(xat), max(xat)), xat = xat, col = col, alpha = 0.3, # doesnt work grid.col = 'transparent', add.border = TRUE, border.col = 'transparent', # doesnt work add.median = TRUE, median = pred$fit, median.col = 'black', main = 'border.col = \'transparent\', alpha = 0.3\' do not work when groups = NULL', main.cex = 0.9 );Solution
For now, the solution is to provide a madeup constant group variable:
create.polygonplot( formula = NA ~ hp, data = pred, min = pred$lower, max = pred$upper, ylimits = c(min(yat), max(yat)), yat = yat, xlimits = c(min(xat), max(xat)), xat = xat, col = col, alpha = 0.3, # doesnt work grid.col = 'transparent', add.border = TRUE, border.col = 'transparent', add.median = TRUE, median = pred$fit, median.col = 'black', main = 'border.col = \'transparent\' and alpha = 0.3\' work with madeup groups', main.cex = 1, groups = rep(1, nrow(pred)) # madeup constant groups );Created on 2025-08-05 with reprex v2.1.1