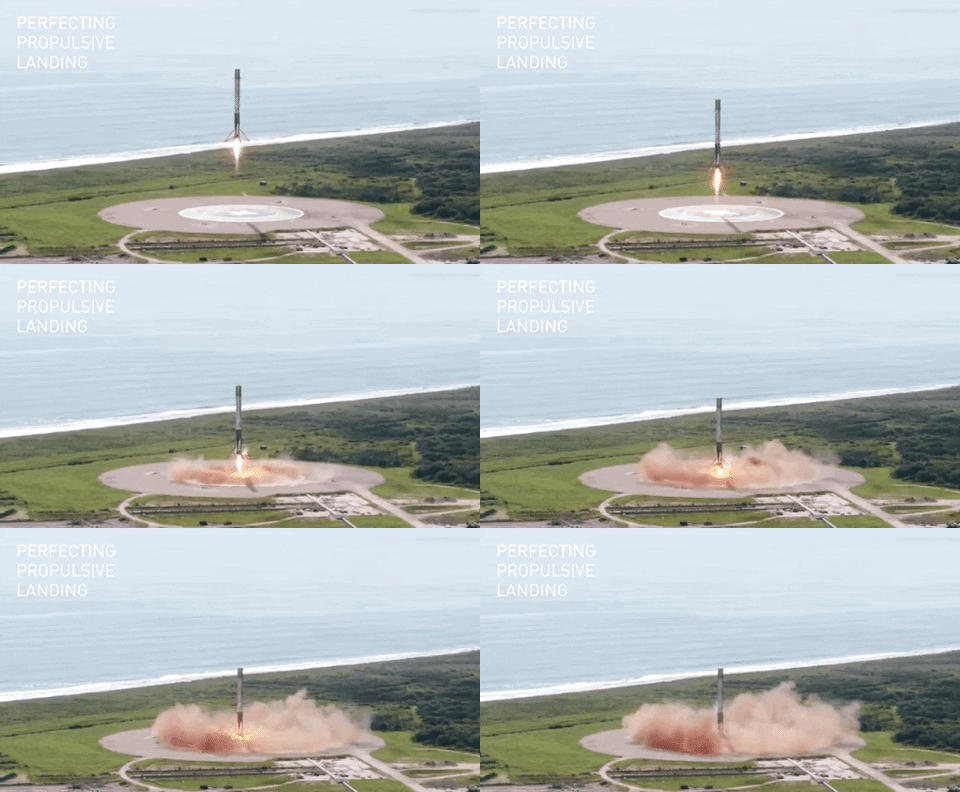
SpaceX has transformed commercial spaceflight by making rockets partially reusable. The defining innovation of these rockets is that the first-stage booster can return and land vertically after launch, allowing it to be reused instead of discarded. The successful reusability dramatically lowers launch costs and enables an unprecedented launch frequency. Predicting first‑stage landing outcomes is essential for mission planning, cost modeling, and understanding the operational reliability of reusable rockets.
This project builds a full end-to-end data science project to predict whether the first stage will land successfully. The project covers the complete pipeline from raw data collection through to machine learning model deployment.
This project walks through:
- Collecting and enriching launch data from the SpaceX API and web scraping
- Data wrangling; SQL-based exploration
- Exploratory data analysis; data visualization
- An interactive dashboard for exploring launch outcomes
- Geospatial analysis of launch site locations (Folium maps)
- Training and comparing multiple classification models
├── DataCollection/
│   ├── DataCollection_API.ipynb
│   └── WebScraping.ipynb
├── EDA&DataWrangling/
│   ├── DataWrangling.ipynb
│   ├── EDAwithSQL.ipynb
│   └── Visualization.ipynb
├── InteractiveDashboard/
│   ├── Dashboard.ipynb
│   ├── app.py
│   ├── requirements.txt
│   └── spacex_launch_dash.csv
├── InteractiveFoliumMap/
│   └── Folium.ipynb
└── ML Prediction/
    └── Prediction.ipynb
Launch data is gathered from two sources:
- SpaceX REST API — queries
api.spacexdata.com/v4/launches/pastand enriches ID fields (rocket, launchpad) by querying additional endpoints. Filters to Falcon 9 only and handles missing payload mass values. - Web Scraping — uses BeautifulSoup to scrape supplemental Falcon 9 launch records from public HTML tables.
- Initial inspection, cleaning, and standardization of the dataset
- Creation of the binary classification target variable (landing success/failure)
- SQL-based exploration to validate assumptions and uncover patterns
- Visual analysis to identify potential predictors and inform feature engineering
A Dash + Plotly dashboard for exploring launch outcomes by site, payload mass, and booster category.
View Live DashboardTo run locally:
pip install -r requirements.txt
python app.pyInteractive map analysis using Folium to explore how launch site location relates to outcomes. Measures distances from KSC LC-39A to surrounding infrastructure:
| Map | Description |
|---|---|
| map_marker.html | All launch sites with success (green) / failure (red) markers |
| map_coast.html | Distance to closest coastline (~6.41 km) |
| map_city.html | Distance to closest city (~16.31 km) |
| map_railway.html | Distance to closest railway (~6.03 km) |
Four classification models trained and evaluated using GridSearchCV with 10-fold cross-validation:
- Logistic Regression
- Support Vector Machine (SVM)
- Decision Tree
- K-Nearest Neighbors (KNN)
Models evaluated on accuracy score, confusion matrices, and comparative performance visualization.
- Data: Python, Pandas, NumPy, BeautifulSoup, Requests
- EDA: SQL, Matplotlib, Seaborn
- Geospatial: Folium
- Dashboard: Dash, Plotly
- ML: scikit-learn (StandardScaler, GridSearchCV, LogisticRegression, SVC, DecisionTreeClassifier, KNeighborsClassifier)
View the full code on GitHub →
A successful land launch: