Citrix ADC offers the two-tier architecture deployment solution to load balance the enterprise grade applications deployed in microservices and access those through internet. Tier 1 can have traditional load balancers such as VPX/SDX/MPX, or CPX (containerized Citrix ADC) to manage high scale north-south traffic. Tier 2 has CPX deployment for managing microservices and load balances the north-south & east-west traffic.

In the Kubernetes cluster, pod gets deployed across worker nodes. Below screenshot demonstrates the microservice deployment which contains 3 services marked in blue, red and green colour and 12 pods running across two worker nodes. These deployments are logically categorized by Kubenetes namespace (e.g. team-hotdrink namespace)

Here are the detailed demo steps in cloud native infrastructure which offers the tier 1 and tier 2 seamless integration along with automation of proxy configuration using yaml files.
- Bring your own nodes (BYON) Kubernetes is an open-source system for automating deployment, scaling, and management of containerized applications. Please install and configure Kubernetes cluster with one master node and at least two worker node deployment. Recommended OS: Ubuntu 16.04 desktop/server OS. Visit: https://kubernetes.io/docs/setup/scratch/ for Kubernetes cluster deployment guide. Once Kubernetes cluster is up and running, execute the below command on master node to get the node status.
cmd: kubectl get nodes
 (Screenshot above has Kubernetes cluster with one master and two worker node).
- Set up a Kubernetes dashboard for deploying containerized applications. Please visit https://kubernetes.io/docs/tasks/access-application-cluster/web-ui-dashboard/ and follow the steps mentioned to bring the Kubernetes dashboard up as shown below.

- Create a namespaces using Kubernetes master CLI console.
cmd:
kubectl create namespace tier-2-adc
kubectl create namespace team-hotdrink
kubectl create namespace team-colddrink
kubectl create namespace team-guestbook
kubectl create namespace monitoring
Once you execute above commands, you should see the output given in below screenshot using command:
cmd: kubectl get namespaces

-
Copy the yaml files from
/example-cpx-vpx-for-kubernetes-2-tier-microservices/config/to master node in/root/yamls directory -
Go to Kubenetes dashboard and deploy the
rbac.yamlin the default namespace
cmd: kubectl create -f /root/yamls/rbac.yaml
- Deploy the CPX for hotdrink, colddrink and guestbook microservices using following commands,
Pre-Requsites:
Get the imagePullSecrets
citrix cpx images requires "image pull secrets" to download the image.
For secret, raise a request to Citrix Slack.

Update the Secret
Update the ".dockerconfigjson" field under secret in cpx.yml
cmd: kubectl create -f /root/yamls/cpx-svcacct.yaml -n tier-2-adc
cmd: kubectl create -f /root/yamls/cpx.yaml -n tier-2-adc
cmd: kubectl create -f /root/yamls/hotdrink-secret.yaml -n tier-2-adc
- Deploy the three hotdrink beverage microservices using following commands
cmd: kubectl create -f /root/yamls/team_hotdrink.yaml -n team-hotdrink
cmd: kubectl create -f /root/yamls/hotdrink-secret.yaml -n team-hotdrink
- Deploy the colddrink beverage microservice using following commands
cmd: kubectl create -f /root/yamls/team_colddrink.yaml -n team-colddrink
cmd: kubectl create -f /root/yamls/colddrink-secret.yaml -n team-colddrink
- Deploy the guestbook no sql type microservice using following commands
cmd: kubectl create -f /root/yamls/team_guestbook.yaml -n team-guestbook
-
Login to empty VPX box to verify no config present before we automate the configuration of VPX.
-
Deploy the VPX ingress and ingress controller to tier-2-adc namespace which configures VPX automatically.
cmd: kubectl create -f /root/yamls/ingress_vpx.yaml -n tier-2-adc
cmd: kubectl create -f /root/yamls/cic_vpx.yaml -n tier-2-adc
Note:
Go to ingress_vpx.yaml and change the IP address of ingress.citrix.com/frontend-ip: "x.x.x.x" annotation to one of the free IP which will act as content switching vserver for accessing microservices.
e.g. ingress.citrix.com/frontend-ip: "10.105.158.160"
Go to cic_vpx.yaml and change the NS_IP value to your VPX NS_IP.
- name: "NS_IP" value: "x.x.x.x"
- Add the DNS entries in your local machine host files for accessing microservices though internet.
Path for host file:
C:\Windows\System32\drivers\etc\hostsAdd below entries in hosts file and save the file,
hotdrink.beverages.com colddrink.beverages.com guestbook.beverages.com
- Now you can access each application over the internet.
e.g.
https://hotdrink.beverages.com

-
Deploy the CNCF monitoring tools such as Prometheus and Grafana to collect ADC proxies’ stats. Using the ingress yaml VPX config will be pushed automatically.
cmd: kubectl create -f /root/yamls/monitoring.yaml -n monitoring cmd: kubectl create -f /root/yamls/ingress_vpx_monitoring.yaml -n monitoringNote: Go toingress_vpx_monitoring.yamland change the frontend-ip address fromingress.citrix.com/frontend-ip: "x.x.x.x"annotation to one of the free IP which will act as content switching vserver Prometheus and Grafana portal. e.g.ingress.citrix.com/frontend-ip: "10.105.158.161" -
Add the DNS entries in your local machine host files for accessing monitoring portals though internet. Path for host file:
C:\Windows\System32\drivers\etc\hostsAdd below entries in hosts file and save the file,
grafana.beverages.com prometheus.beverages.com
- Login to
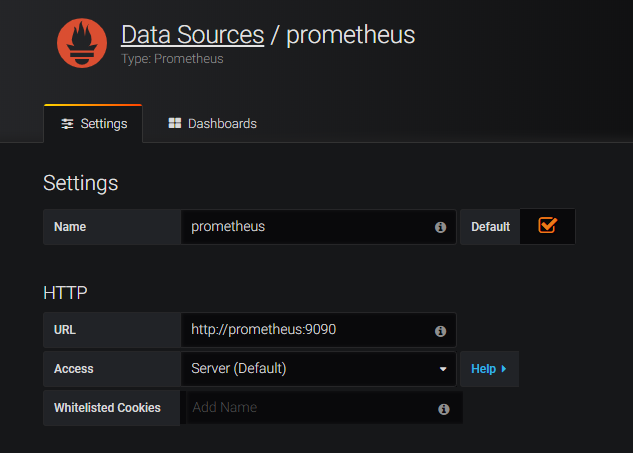
http://grafana.beverages.comand do the following one time setup Login to portal using admin/admin credentials. Click on Add data source and select the Prometheus data source. Do the settings as shown below and click on save & test button.
From the left panel, select import option and upload the json file provided in folder yamlFiles /example-cpx-vpx-for-kubernetes-2-tier-microservices/config/grafana_config.json
Now you can see the Grafana dashboard with basic ADC stats listed.

Citrix ADC solution supports the load balancing of various protocol layer traffic such as SSL, SSL_TCP, HTTP, TCP. Below screenshot has listed different flavours of traffic supported by this demo.
