


Some bad color maps for Matplotlib to make plotting amusing figures easier.
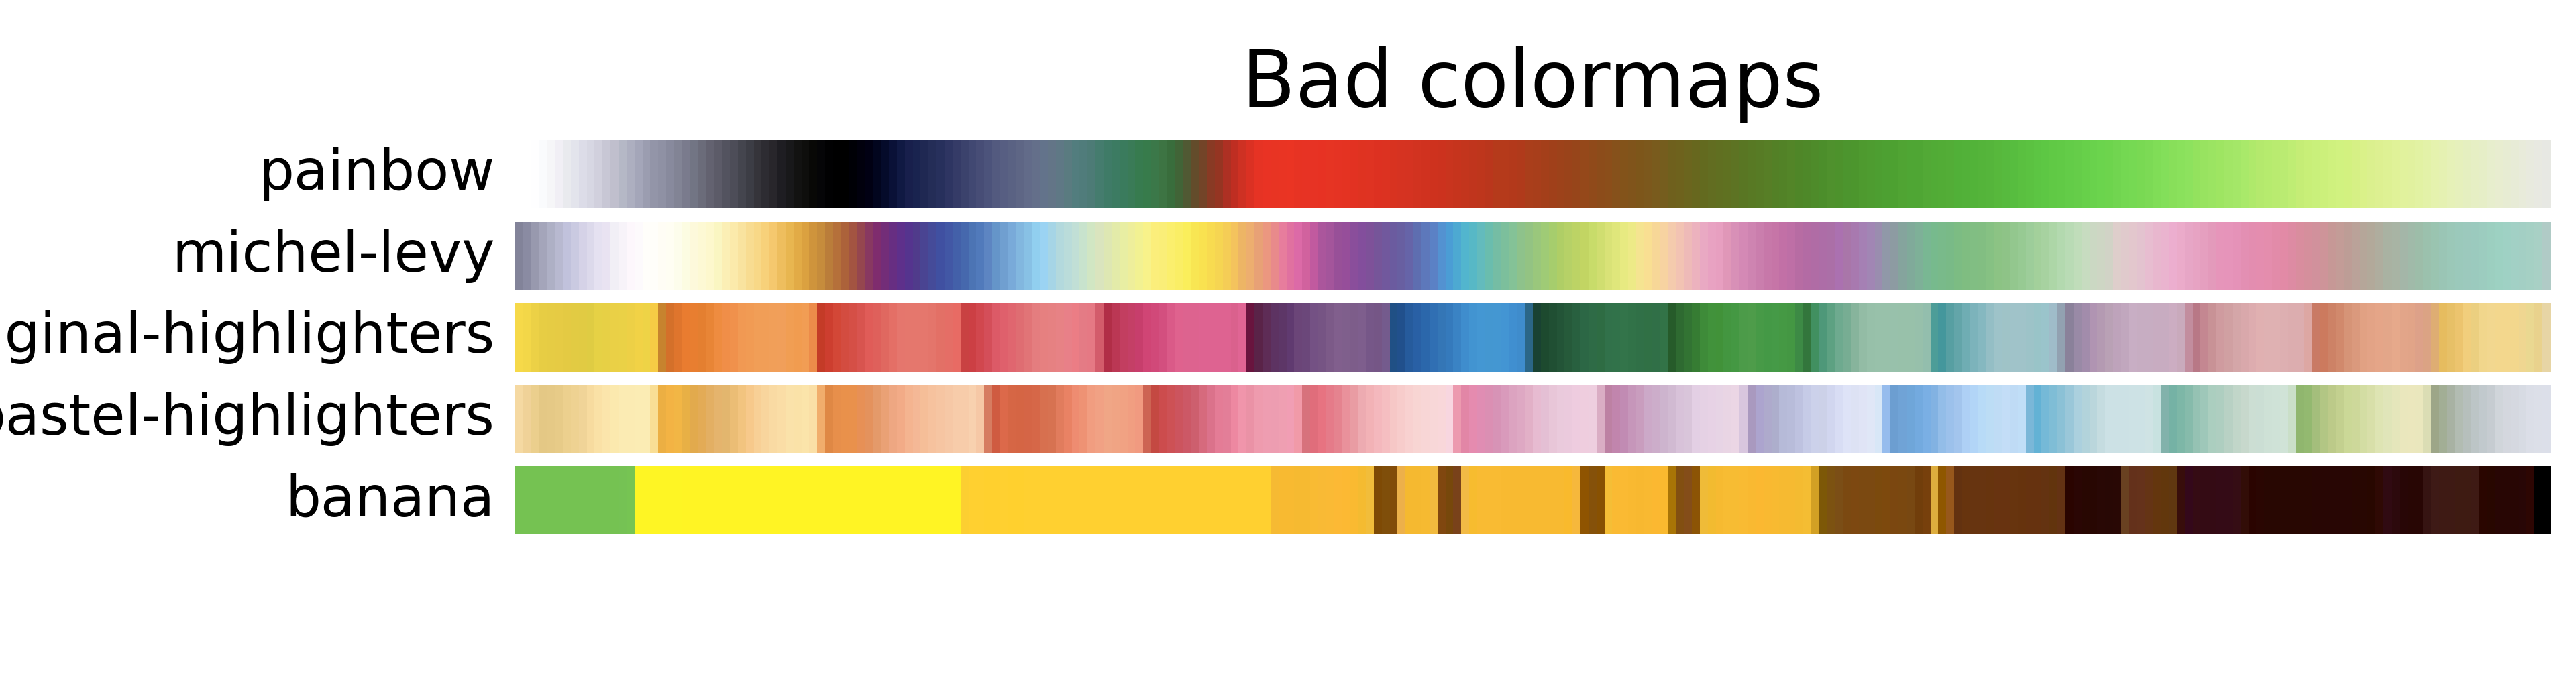
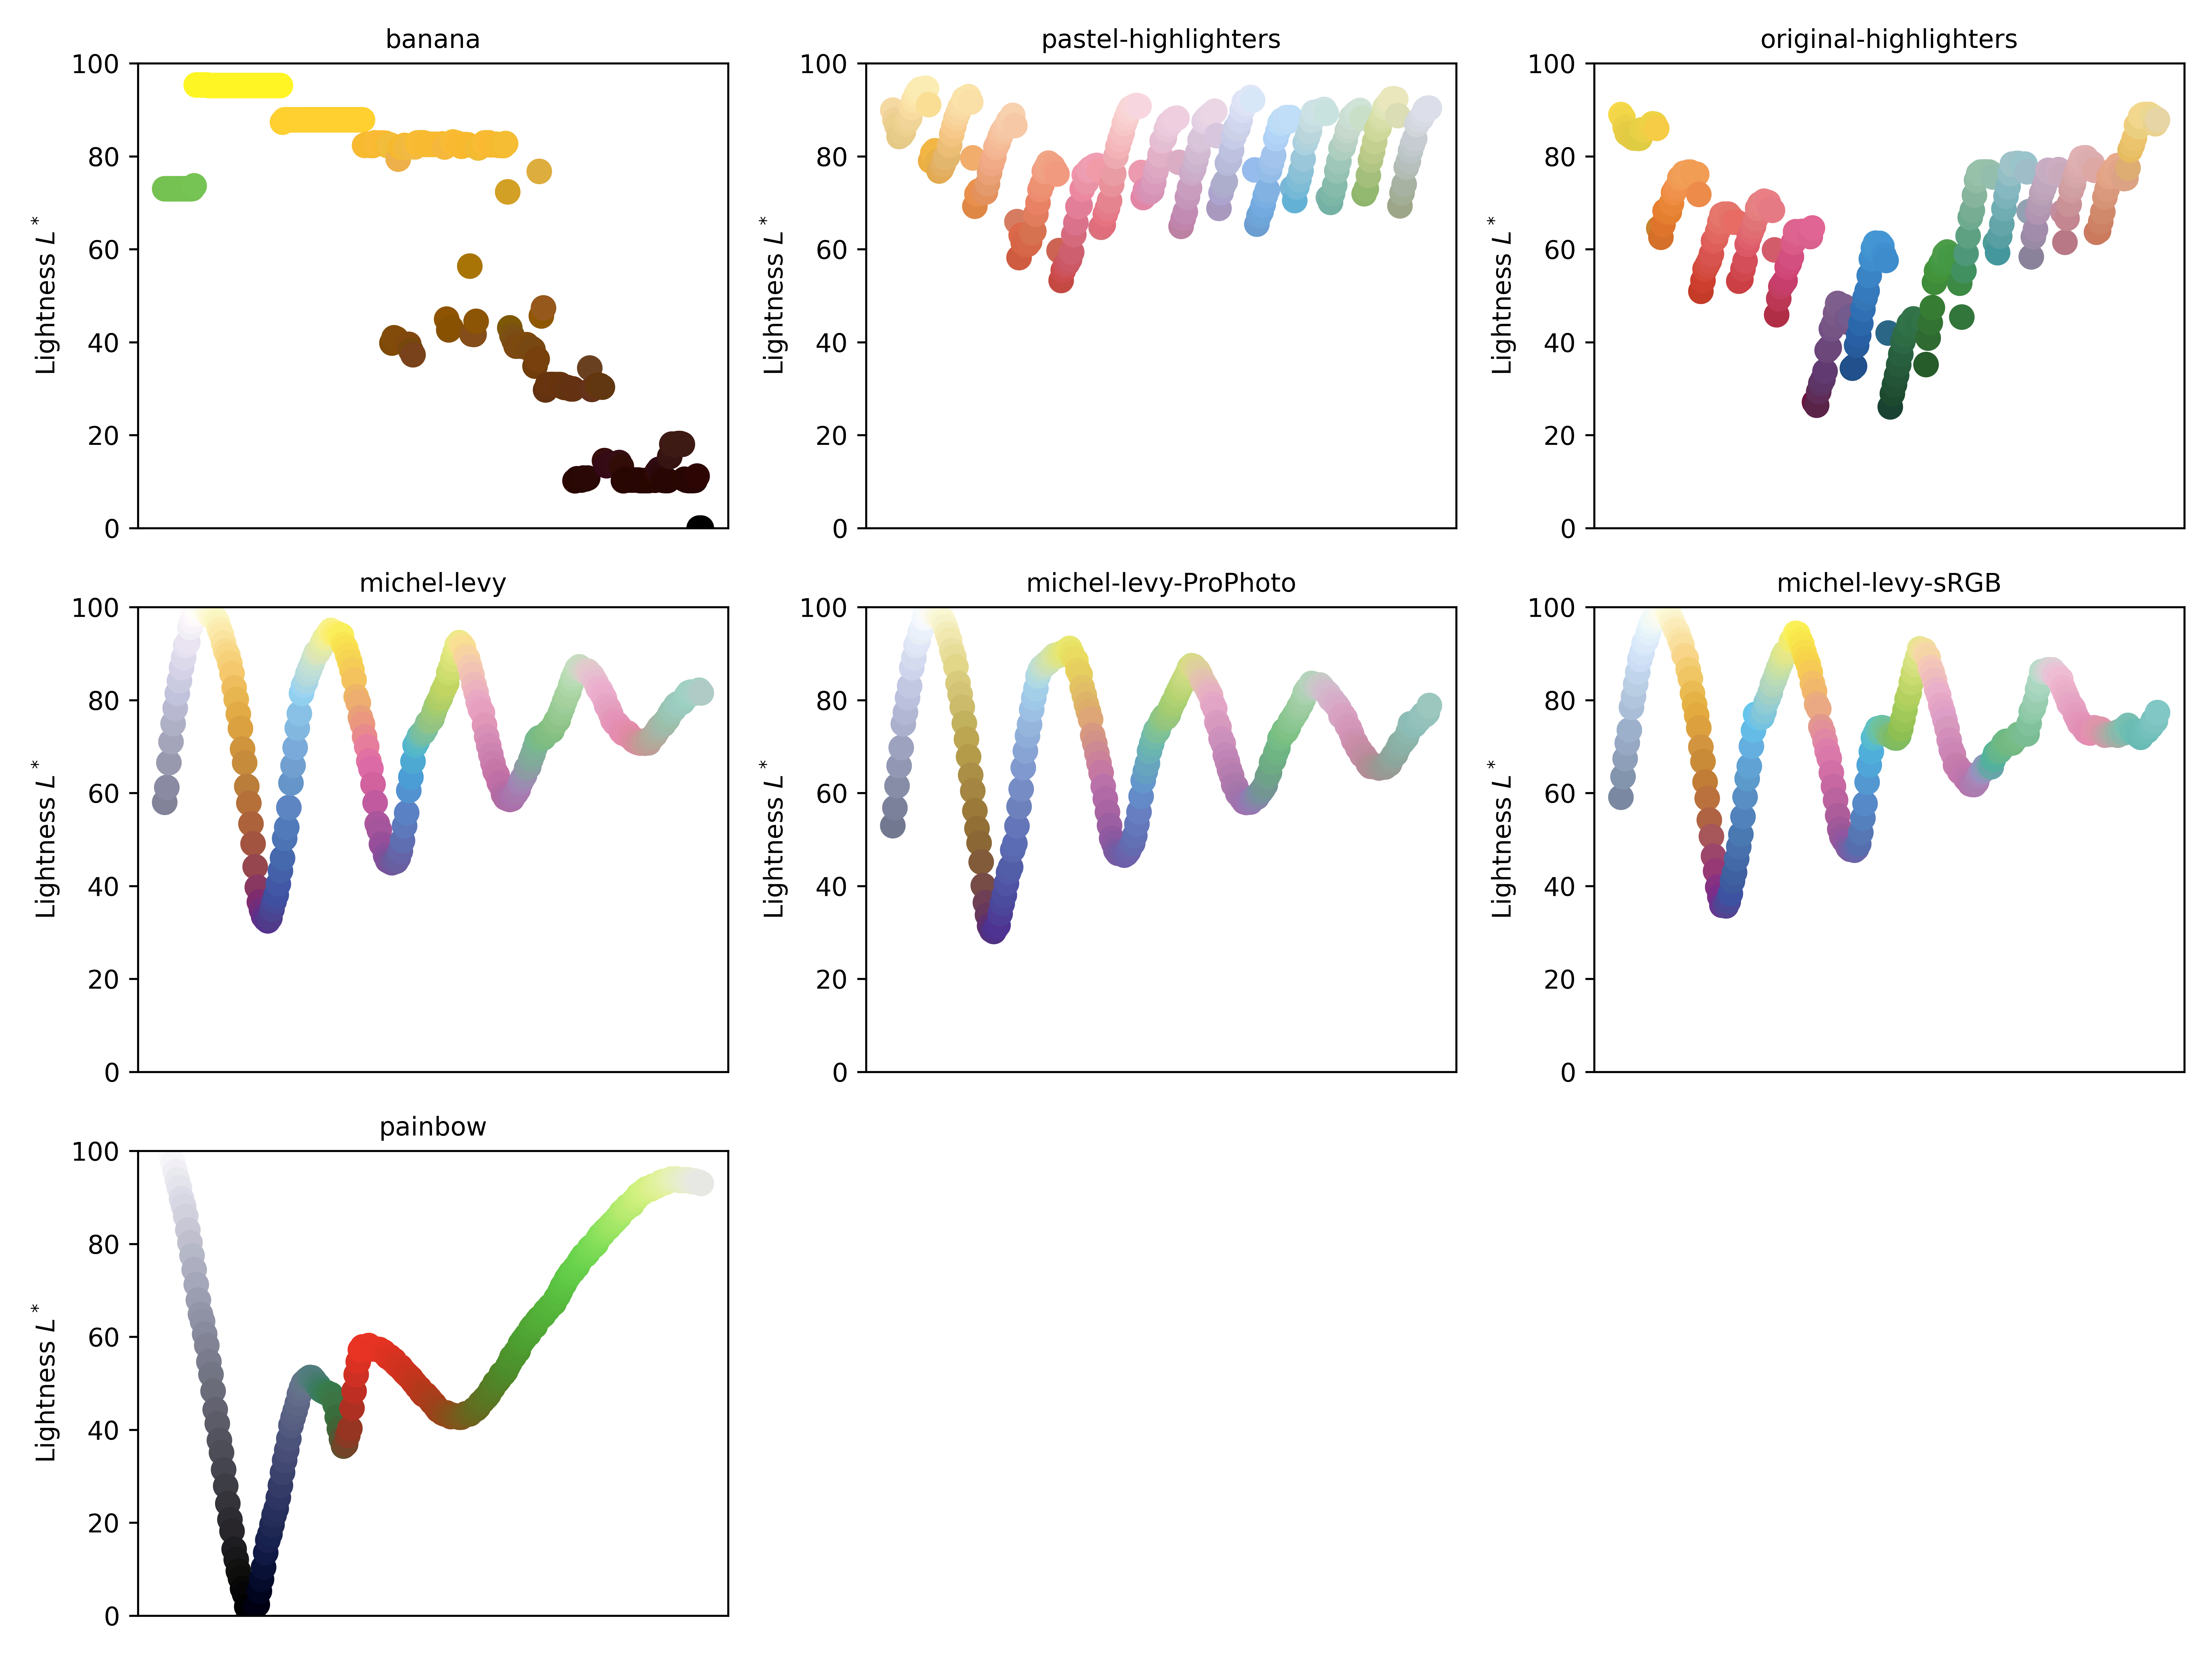
Not the most ideal...
To use this:
import matplotlib.pyplot as plt
import bad_color_map
plt.XYZ(
...
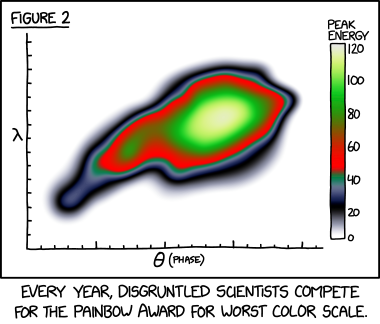
cmap='painbow' # or 'michel-levy'
...
)
- Painbow: XKCD 2537
- Michel-Levy: Bjørn Eske Sørensen; A revised Michel-Lévy interference colour chart based on first-principles calculations. European Journal of Mineralogy 2012;; 25 (1): 5–10. doi: https://doi.org/10.1127/0935-1221/2013/0025-2252
- Pastel Highlighters
- Original Highlighters