This project analyzes pizza store sales data to uncover valuable insights about revenue, customer behavior, and product performance. The analysis helps management make data-driven decisions in sales, marketing, operations, and inventory planning.
- Calculate total revenue, total pizzas sold, and total orders
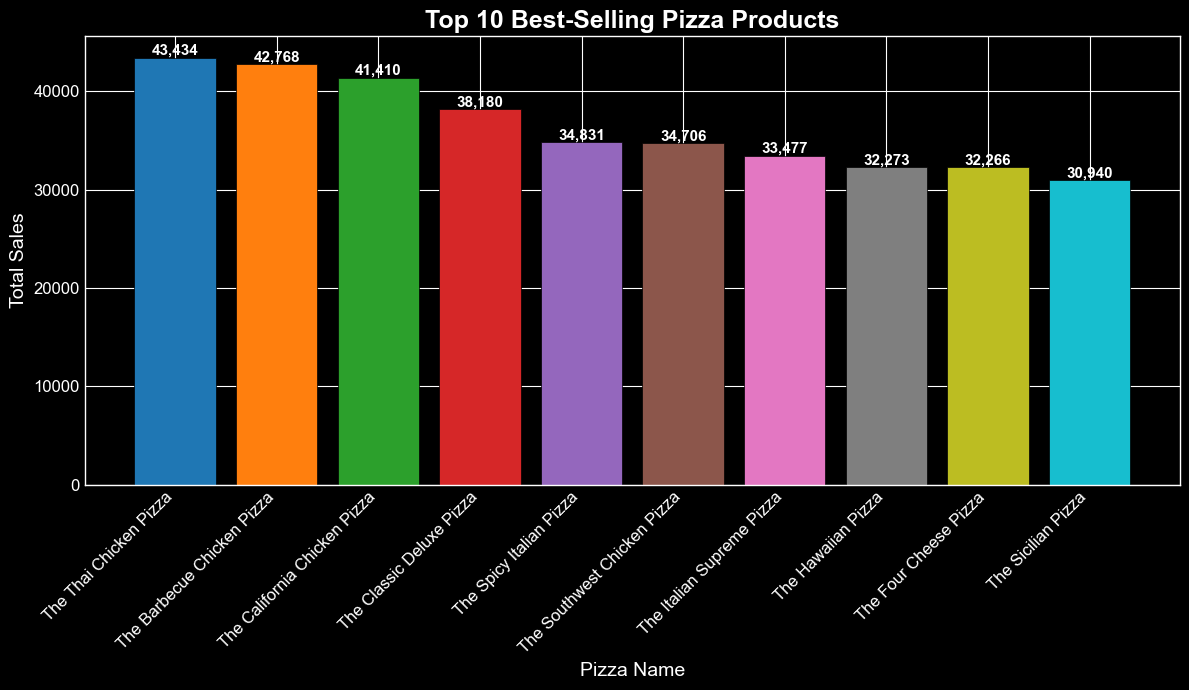
- Identify best-selling and least-selling pizzas
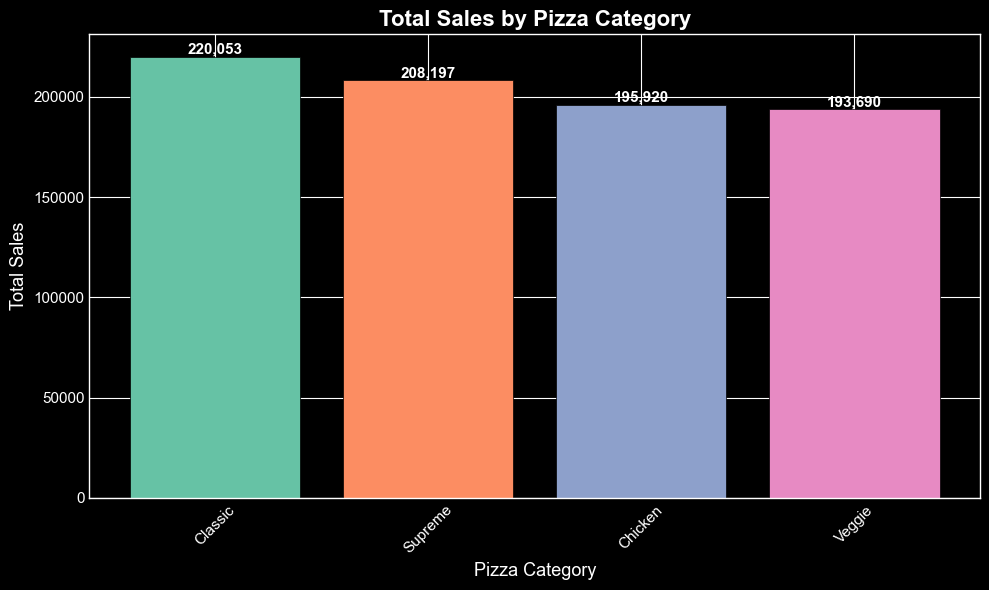
- Analyze sales by category and size
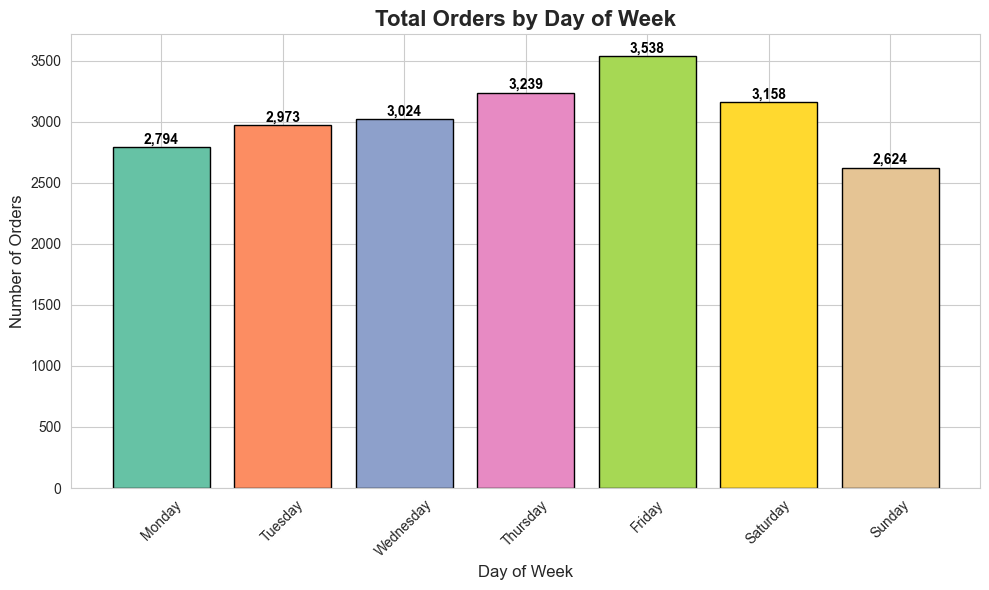
- Explore daily, hourly, and monthly sales trends
- Measure customer behavior with KPIs like:
- Average Order Value (AOV)
- Average Pizzas per Order
- Provide visual dashboards for quick decision-making
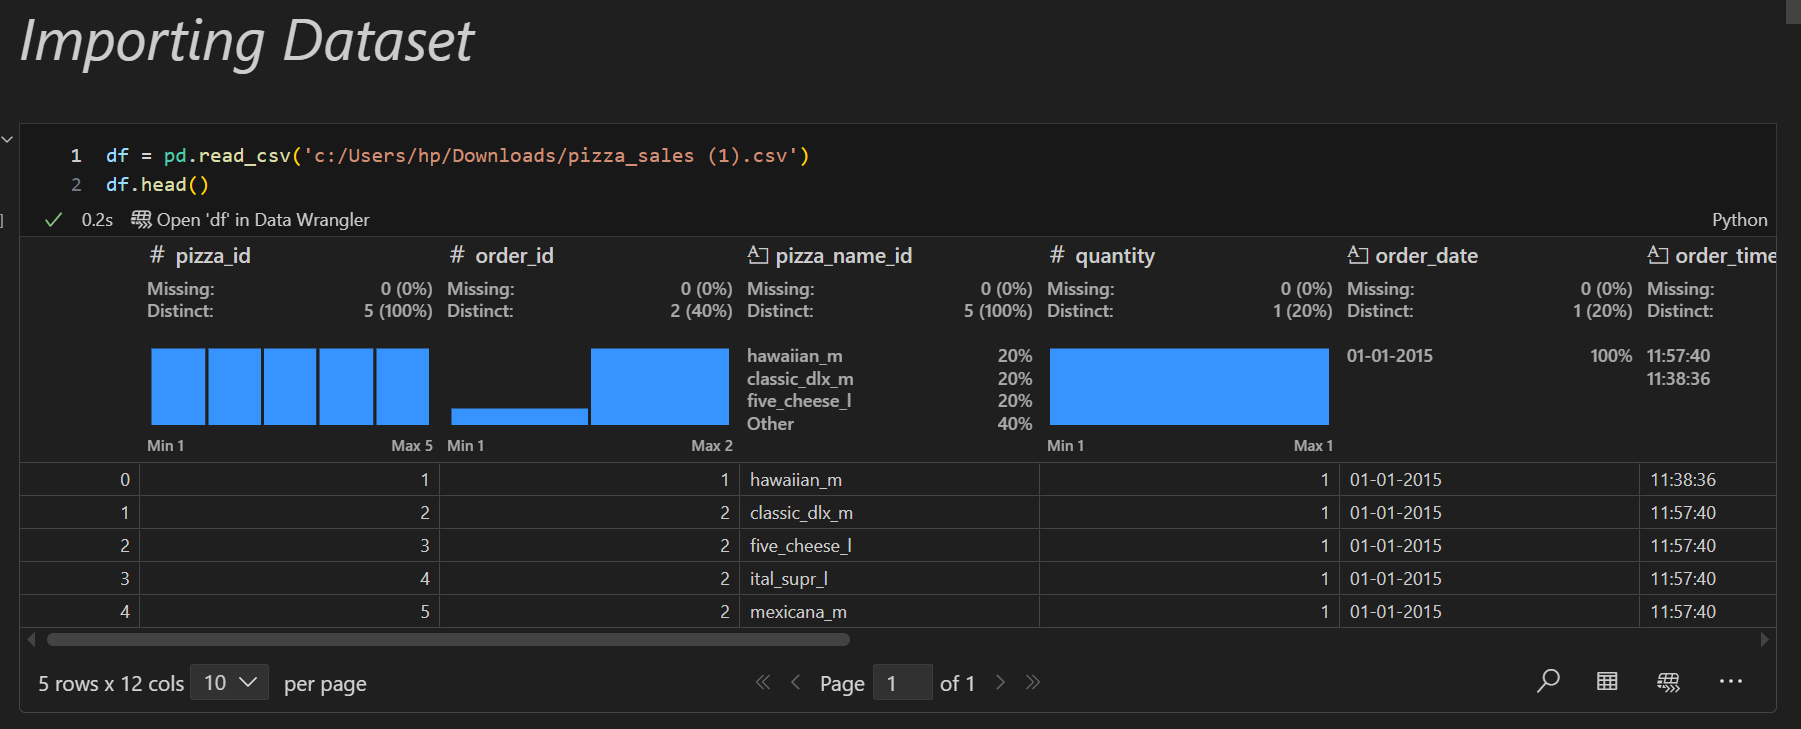
File: pizza_sales.csv
Key Fields:
order_id→ Unique order identifierpizza_id→ Unique pizza identifierpizza_name→ Pizza soldquantity→ Number of pizzas per ordertotal_price→ Revenue per transactiondate,time→ Order timestamppizza_category,pizza_size→ Classification details
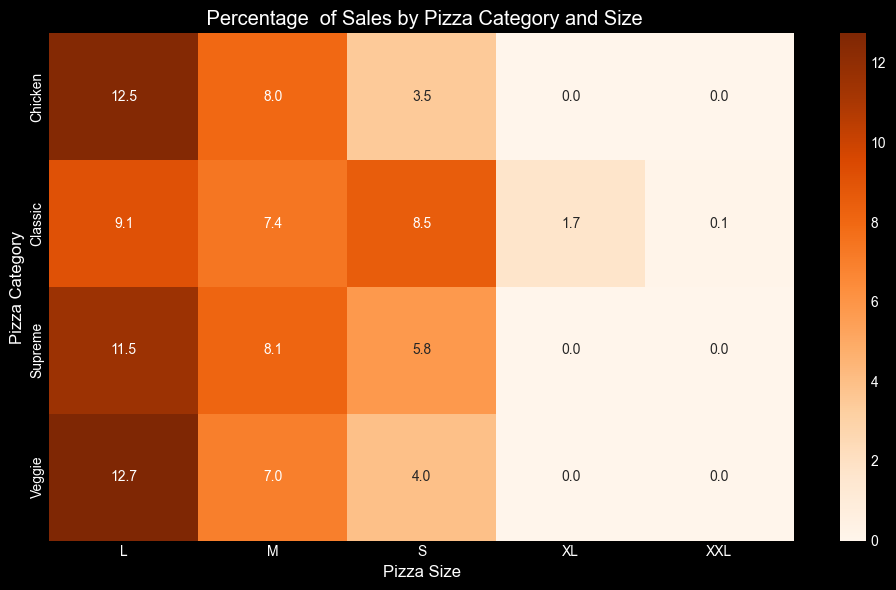
- Large (L) pizzas drive the highest revenue.
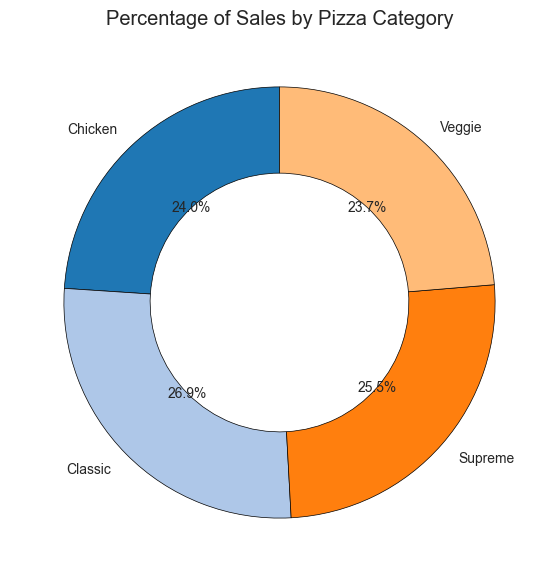
- Classic pizzas are the most popular category, while Veggie pizzas sell less.
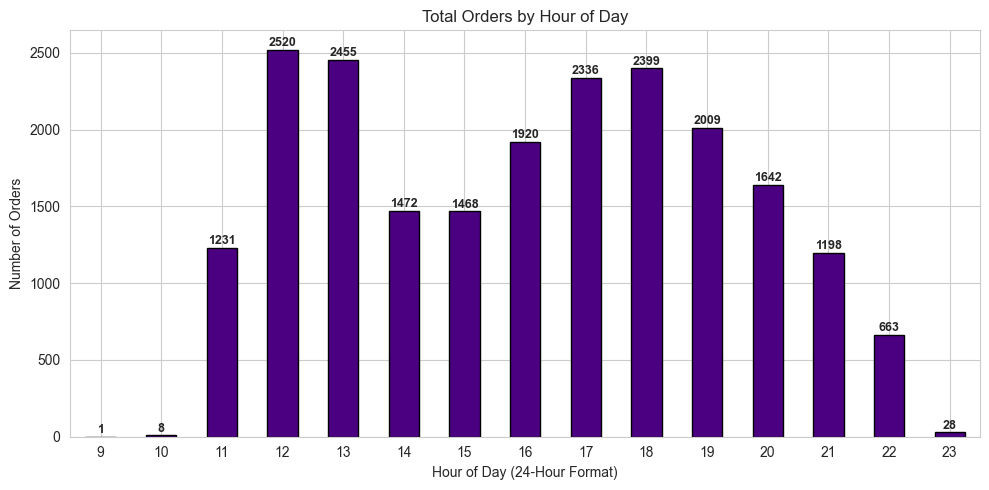
- Peak orders occur during evenings and weekends.
- Some low-performing pizzas may need redesign or removal.
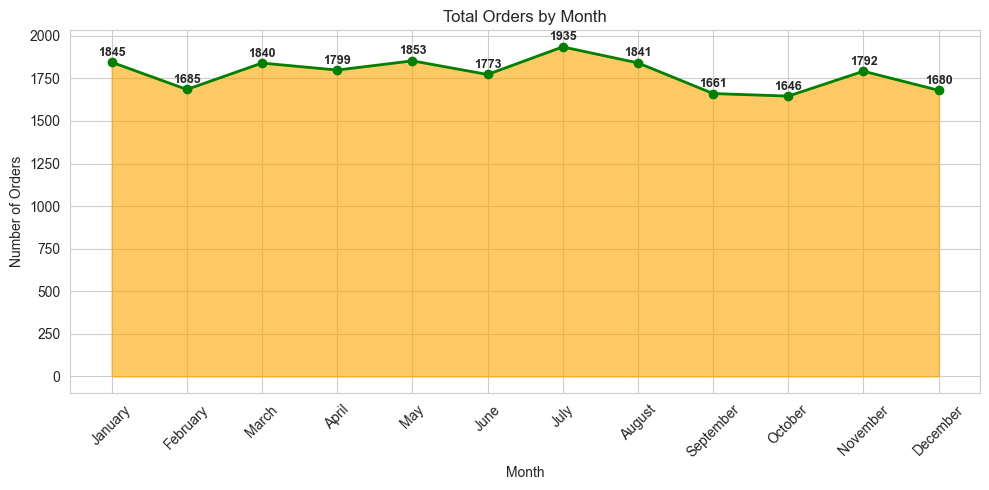
- Marketing campaigns during summer months increase sales.
- Focus promotions on high-selling categories and sizes.
- Reconsider or optimize least-selling pizzas.
- Use sales trends to plan staffing and inventory.
- Regularly monitor KPIs through automated dashboards.
✨ This project demonstrates how Exploratory Data Analysis (EDA) can transform raw sales data into actionable business insights.