NT132 (Networks and Systems Administration) Project - ELK stack, referenced by https://www.elastic.co
Elastic Stack, also known as ELK Stack, is a stack that comprises of three popular projects:
- Elasticsearch
- Logstash
- Kibana
and other components such as:
- Beat
- APM
Elastic Stack is used to take data from any source then search by Elasticsearch, analyze and visualize by Kibana.
Elastic Stack can also be deployed as a Cloud service supported on AWS, Google Cloud, and Azure, or as an on-prem installation.

In this repository, I will only go into detail about Elasticsearch and Kibana.

Scenario: VM1 and VM2 are Ubuntu servers. VM2 for Beat agent, sending metrics of VM2 to VM1. VM1 for ELK stack and AWS S3 setup.
You should think Elasticsearch as the heart of the Elastic Stack, which has near real-time search and analytics for all types of data. Elasticsearch can store and index structured or unstructured text, numerical data, or geospatial data, in a way that supports fast searches. Elasticsearch provides a REST API that enables you to store data in Elasticsearch, retrieve, and analyze it.

You can also use the Elasticsearch clients to access data in Elasticsearch directly from common programming languages, such as Python. Perl, Go, Java, Ruby, and others.
Complex data structures are serialized as JSON documents, distributed across the cluster (in case you deploy a cluster) and accessed from any node.
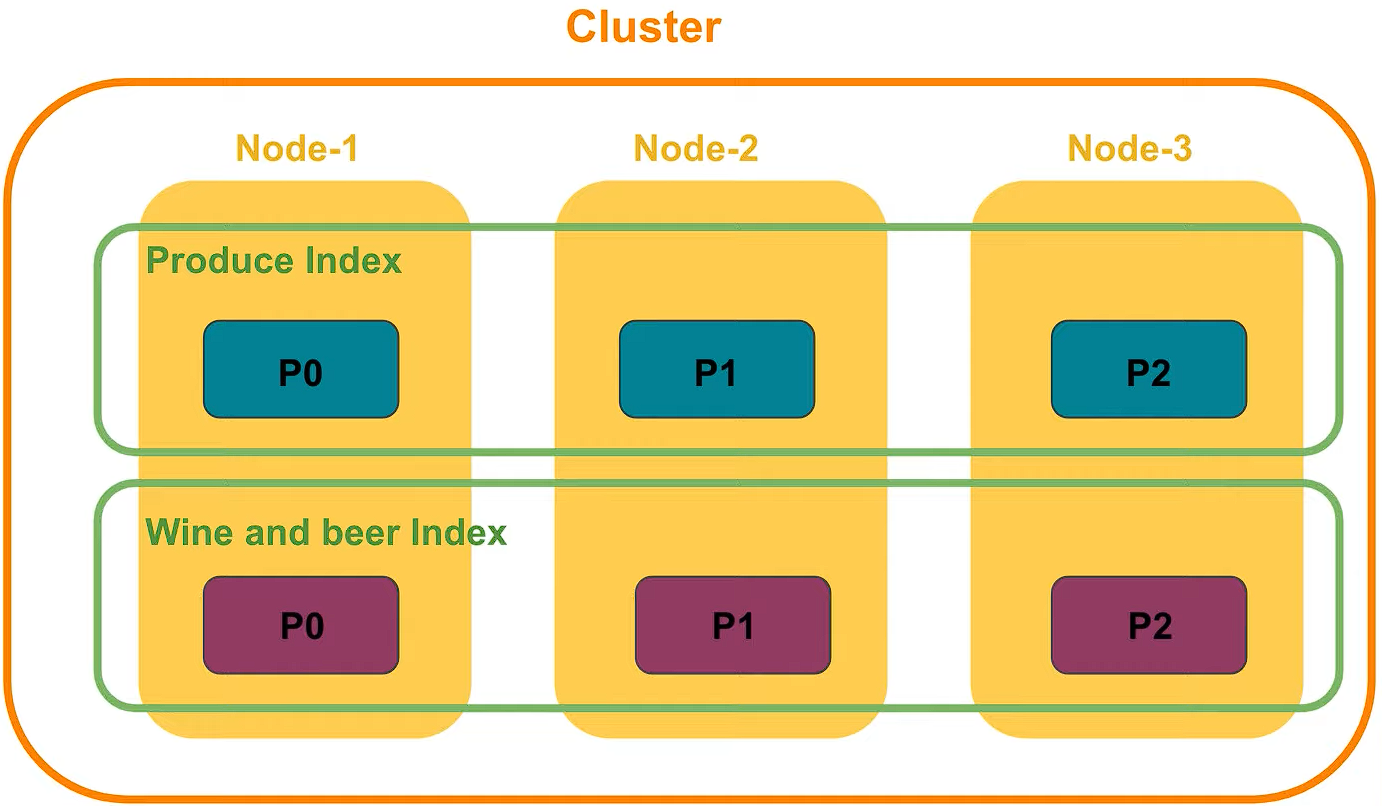
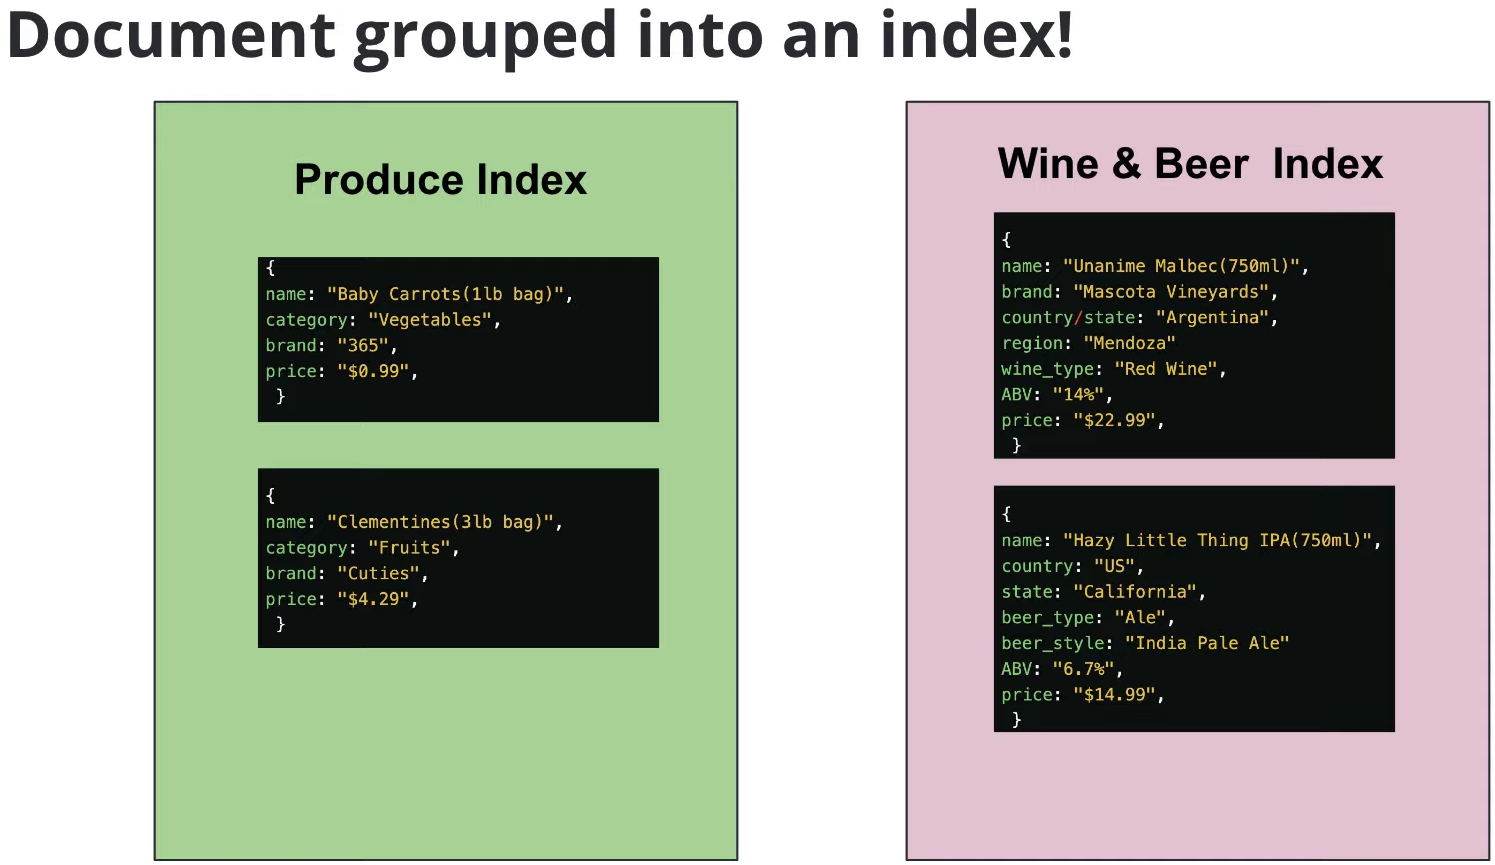
Elasticsearch uses a data structure called an inverted index to store documents. An inverted index lists every unique word that appears in any document and identifies all of the documents each word occurs in. Index can be thought of as an optimized collection of documents and each document is a collection of fields, which are the key-value pairs that contain your data.
To avoid a single point of failure, Elastic supports Cross-cluster replication, which automatically synchronizes indices from your primary cluster to a secondary remote cluster that can serve as a hot backup. If the primary cluster fails, the secondary cluster can take over.
Kibana is the tool to visualize the Elasticsearch data and to manage the Elastic Stack. Kibana is also the home for the Elastic Enterprise Search, Elastic Observability and Elastic Security solutions. Kibana can:
- Create dashboard
- Design graph patterns and relationship
- predict, & detect behavior
- and so on.
- Docker Engine version 18.06.0 or newer (8/12/2023 test on v19.03.9)
- Docker Compose version 1.26.0 or newer (including Compose V2) (8/12/2023 test on v2.21.0)
- More than 6 GB of RAM (because the host consumes lots of memory when runs ELK multi nodes) (8/12/2023 docker v23 results in error "kernel does not support swap limit capabilities or the cgroup is not mounted. memory limited without swap")
The filebeat installation is in https://github.com/PNg-HA/ELK-Run-FileBeat.
Summary
This document will show how to use Docker and Docker Compose to install 3 Elasticsearch nodes in 1 cluser, Kibana to visual and management them, and how to backup and restore the database. The way to install is the final, after hours of fixing bugs during the installation. The demo is at here.
- In a Ubuntu server, create a directory and move into it:
$ mkdir docker-ELK && cd $_
- Make a
docker-compose.ymlfile with the contents fromdocker-compose.yml
Note
This file is at first referenced from the docker-compose file of elastic.co, however I have edited it to fix bugs when build the docker compose up. What I have edited is setting up JVM heap size inenvironmenttag- ES_JAVA_OPTS=-Xms750m -Xmx750min each Elasticsearch node, which prevents the nodes from exiting.
- Create
.envfile with the contents from.env
Note
This file is at first referenced from the .env file of elastic.co, however I have edited it. Besidepasswordandversion, I have also editedMEM_LIMIT= 6442450944 bytes, which is more than 6 GB.
- Increase the limit of
mmap(virtual memory of the host):
$ sudo sysctl -w vm.max_map_count=524288
- At the docker-ELK directory, run the command:
$ docker compose up -d
Wait for about 3 minutes for the ELK to setup.
Note
If there are problems, run$ docker compose logs -f <service>to observe the logs and exit code (search google for it). If you meet the 137 exit code, I recommend this .
- When all 3 nodes are healthy, access the Kibana web UI by opening http://IP-address-of-the-host:5601 in a web browser and use the following (default) credentials to log in:
user: elastic
password: abc123
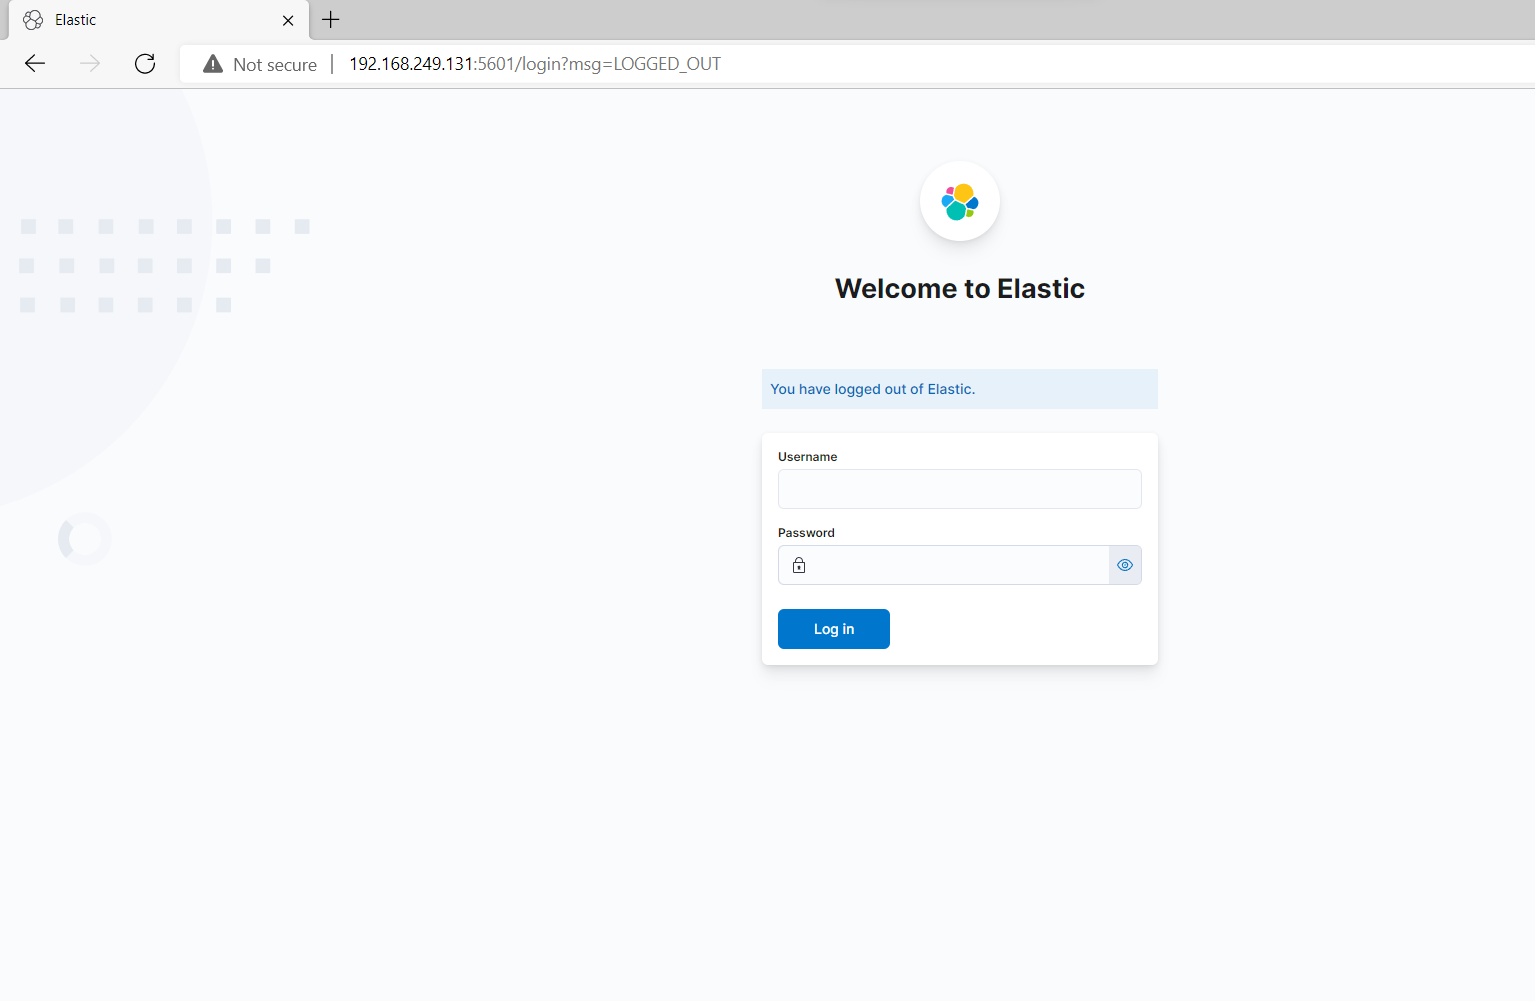
The successful initial setup should result in:

- Display the list of ELK containers:
$docker ps
- Access to each container with
root:
$docker exec -u 0 -it <esearch container id> /bin/bash
$apt-get update
- Install the
nanotext editor:
$apt-get install nano
Ctrl–Dto quit the container and get access to it again with userelasticsearch:
docker exec -it <esearch container id> /bin/bash
- Create a backup directory:
mkdir backup_repo
- Config the
elasticsearch.ymlfile to create a path to the backup directory:
nano config/elasticsearch.yml
- Add
path.repo: /usr/share/elasticsearch/backup_repoto the file. Save the file withCtrl-Sand exit withCtrl-X.
Note
To know the location of directorybackup_repo, use commandpwd
Do these above steps for 3 elasticsearch node and restart them. Then go to the Kibana web UI.
- Go to Stack Management -> Snapshot and Restore -> Repositories
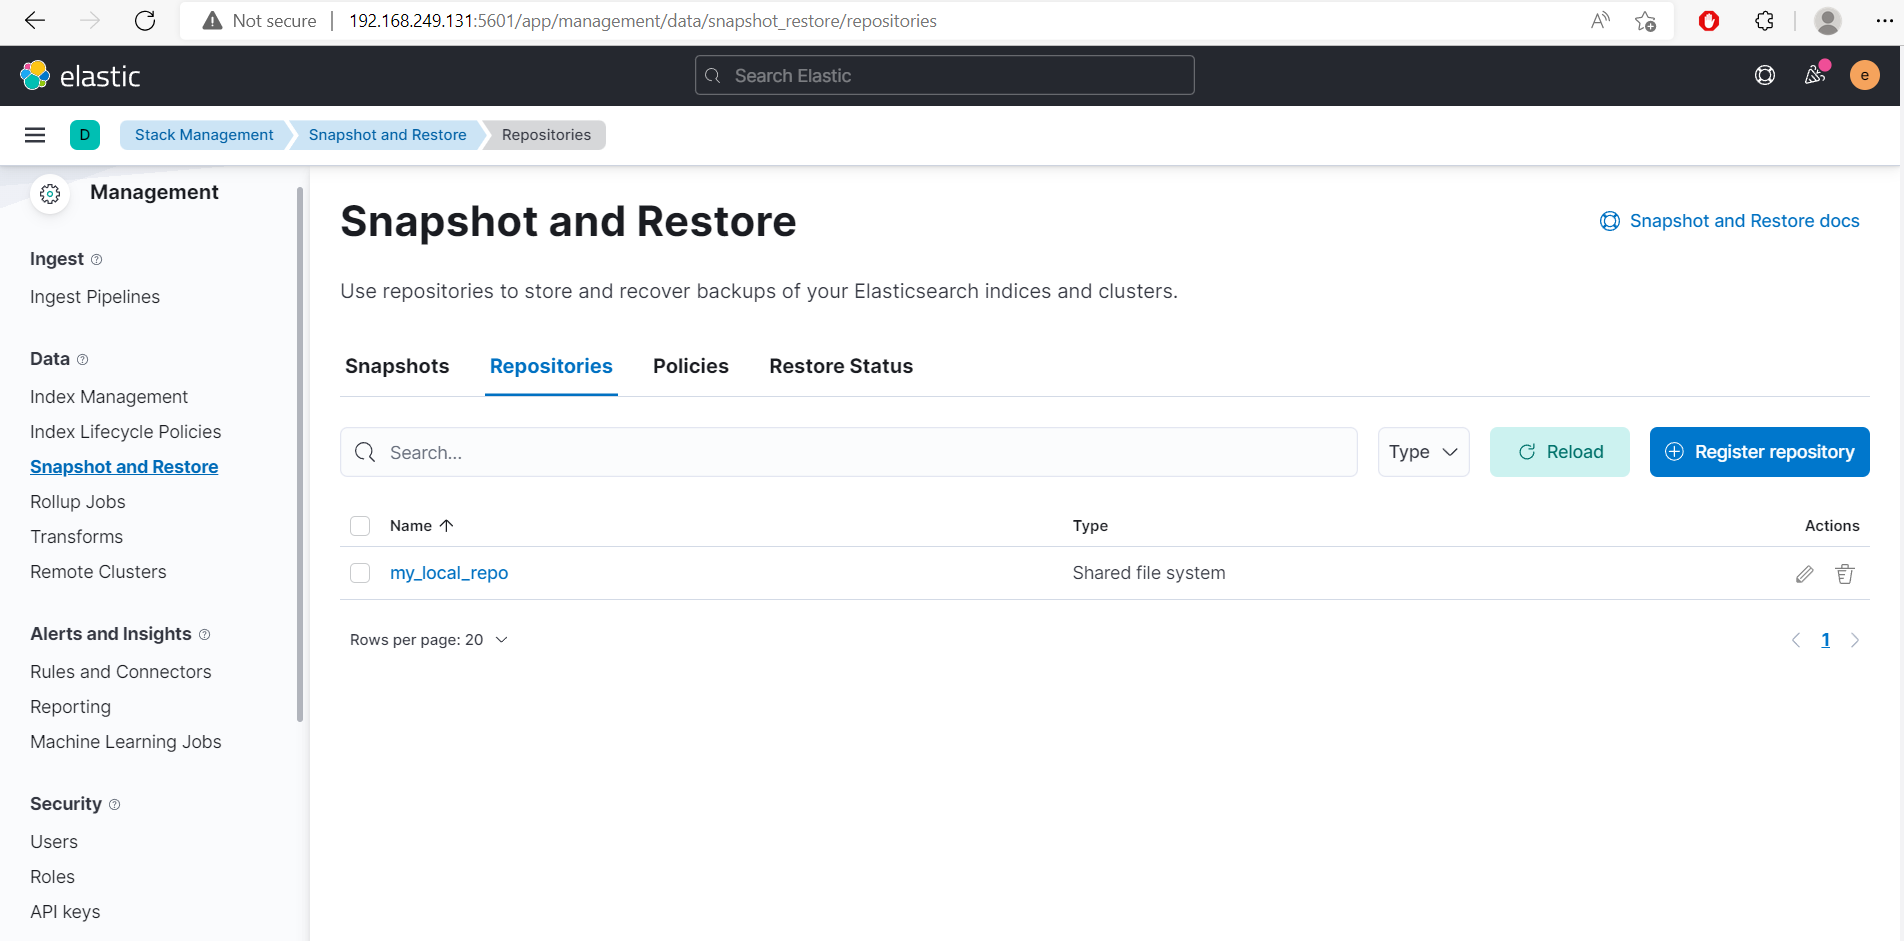
- Select Register repository.
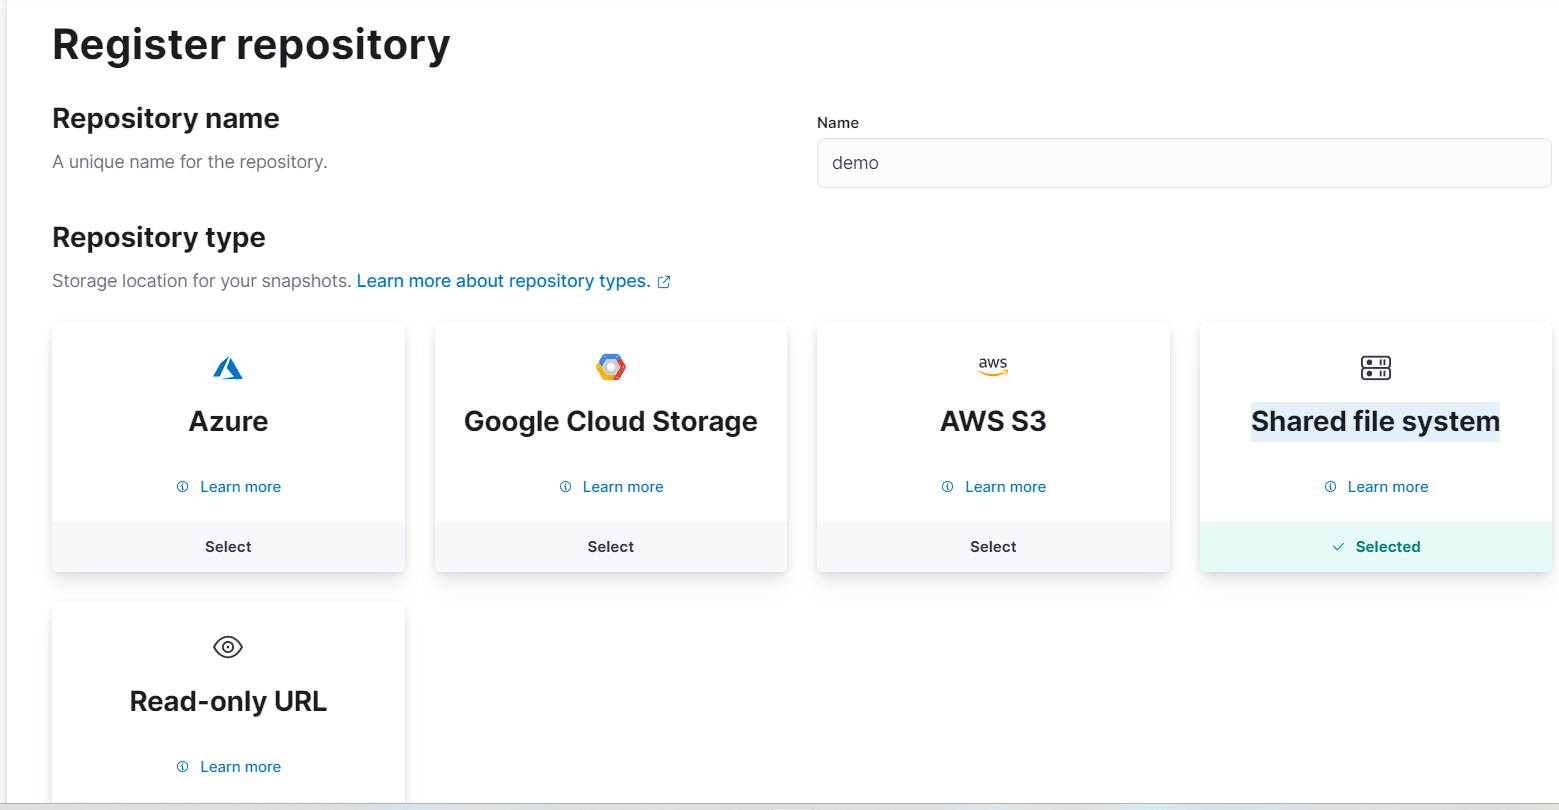
- Name Repository name as
demo. - At Repository type, select Shared file system and Next.
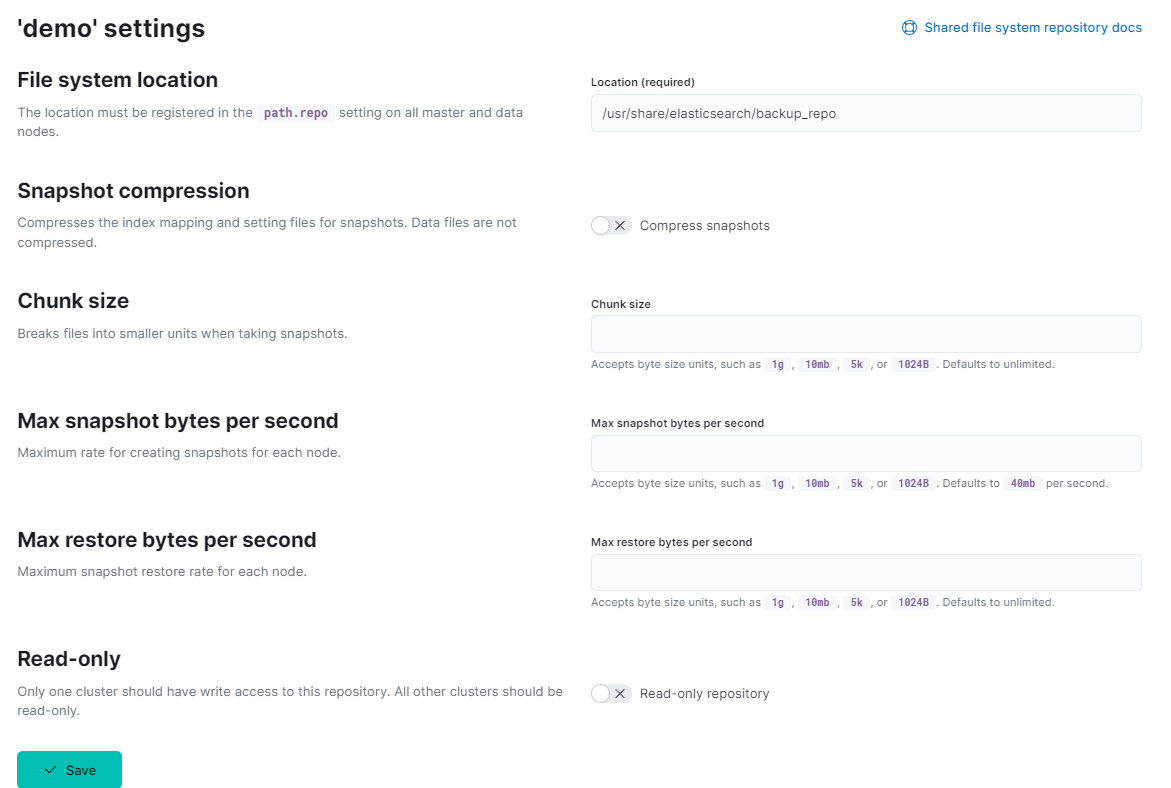
- At the
File system location, type:/usr/share/elasticsearch/backup_repo. Ignore other fields and Save.
-
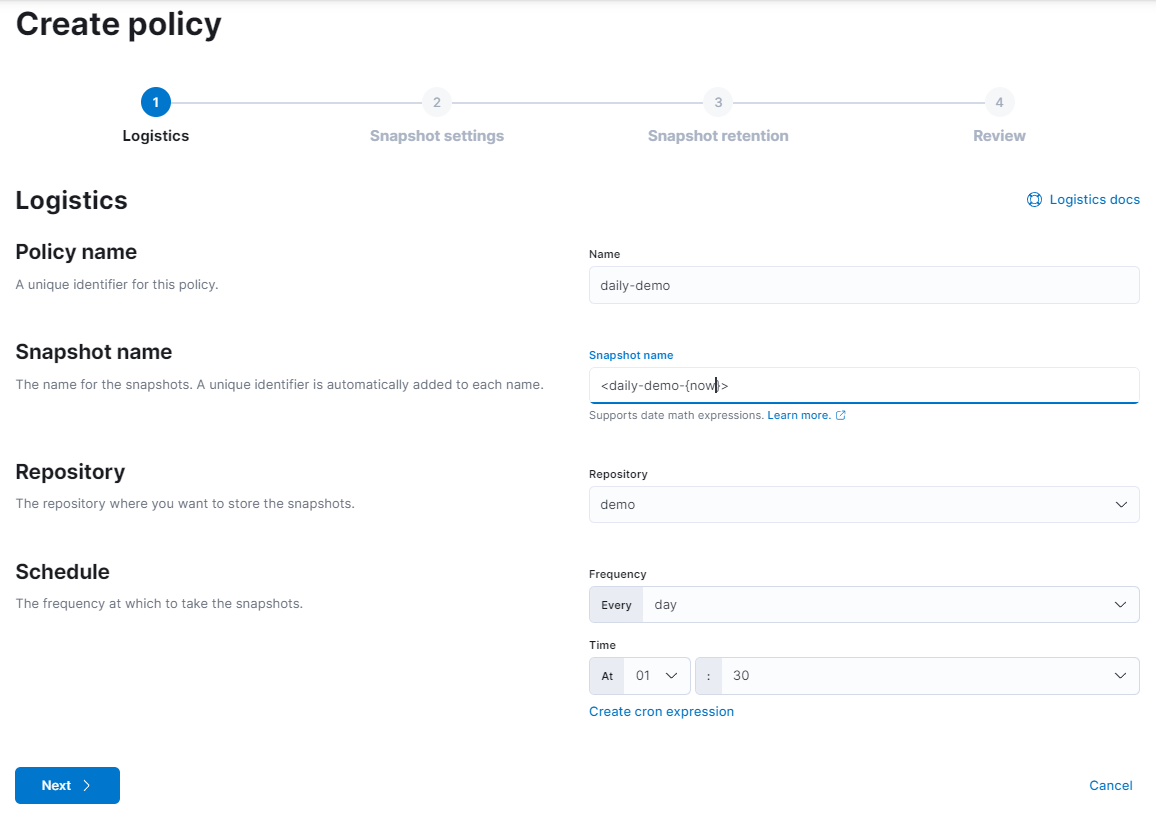
Then move to Policies -> Create policy.
-
At step 1, Logistics, type as your choice and Next.
- At step 2, Snapshot settings, in Data streams and indices, choose only my index:
favor_candy
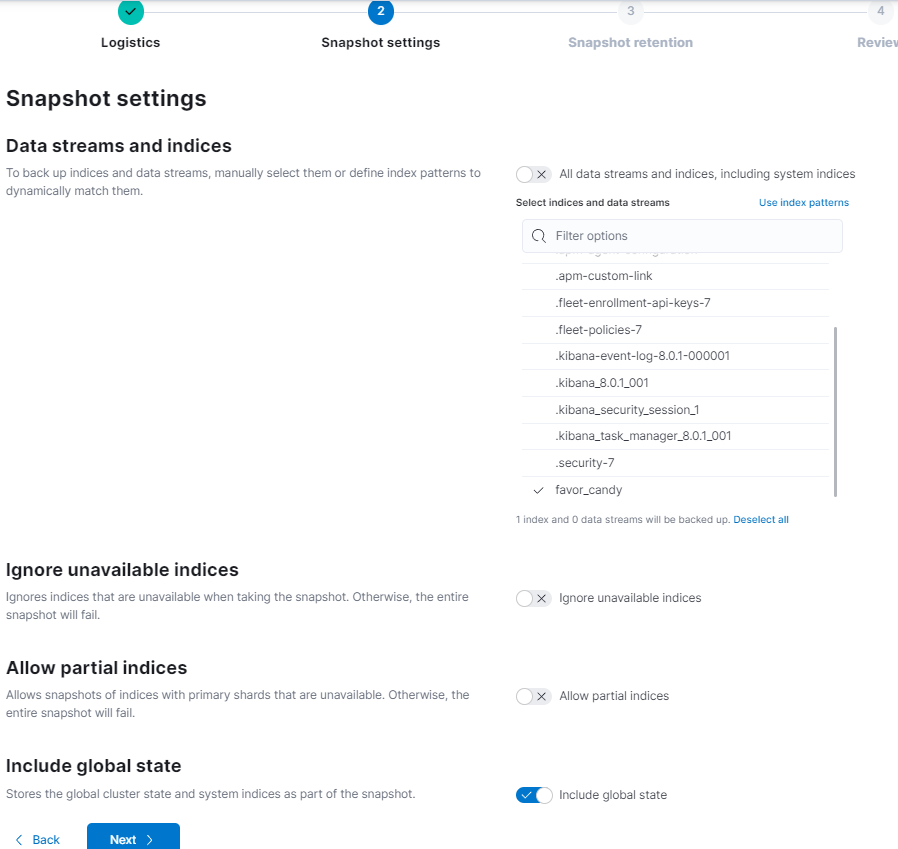
Note If the Include global state show up, then turn on it. Then Next.
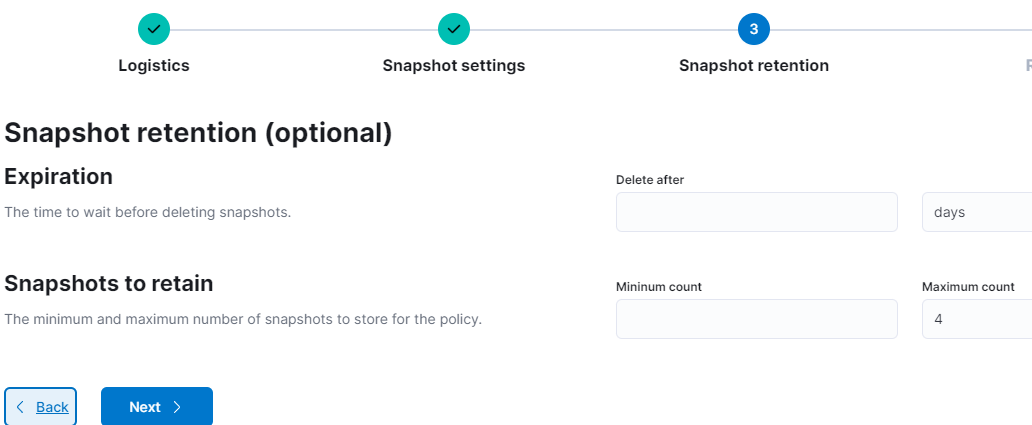
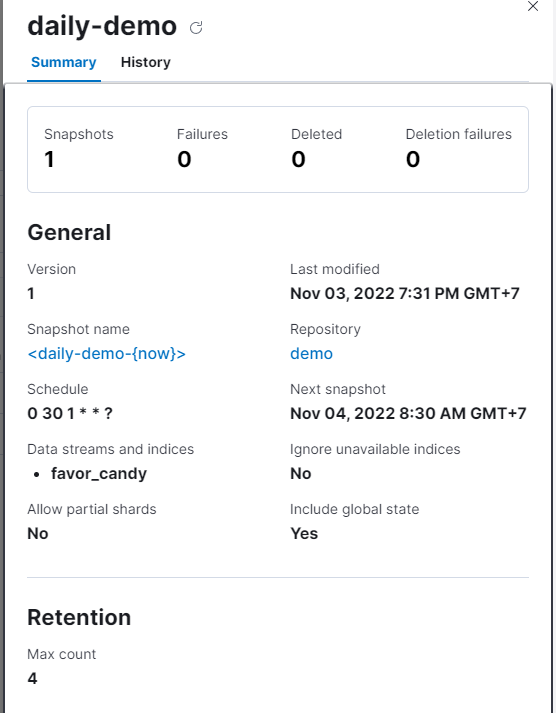
- Step 3 is not important in this document. I only set the
Maximum countto 4. Then Next.
- At step 4, Review, check again.
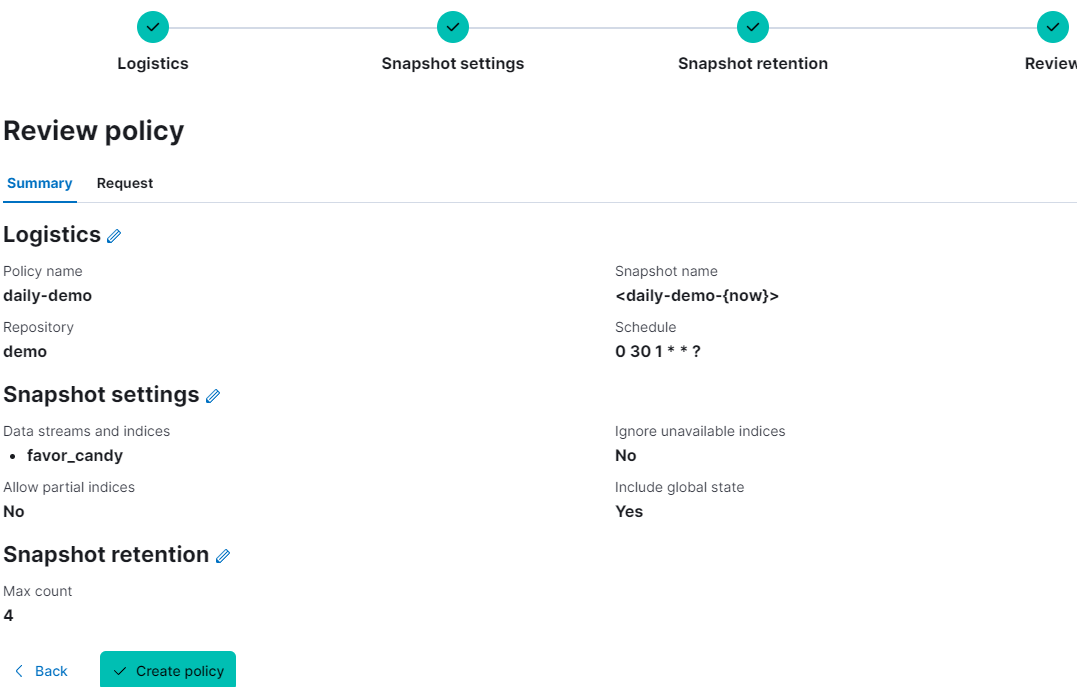
If nothing to edit, then Create policy.
- A pop-up shows up, choose run now.
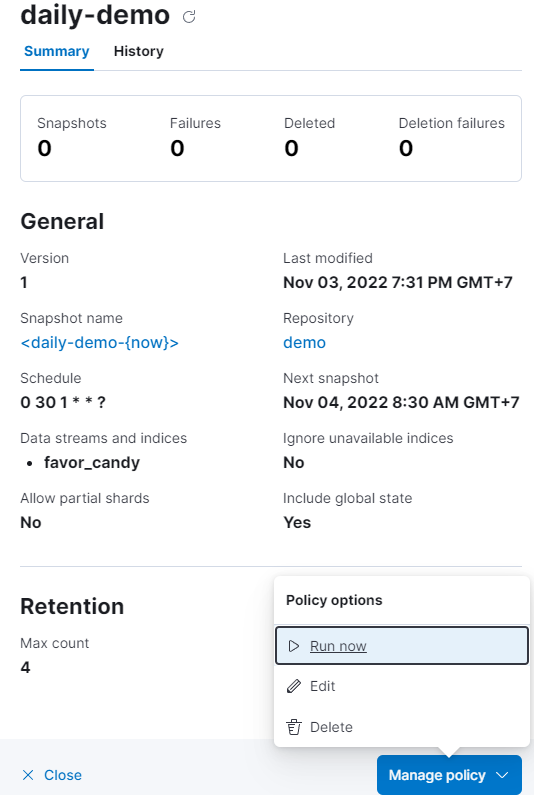
The successful snapshot will look like this:
Note
Elastic has strict rules about restoring indices. It will not allow to restore system files nor the other indices unless they are deleted. This part will restore the indices that I have written inDev Tools
- Now select Snapshot
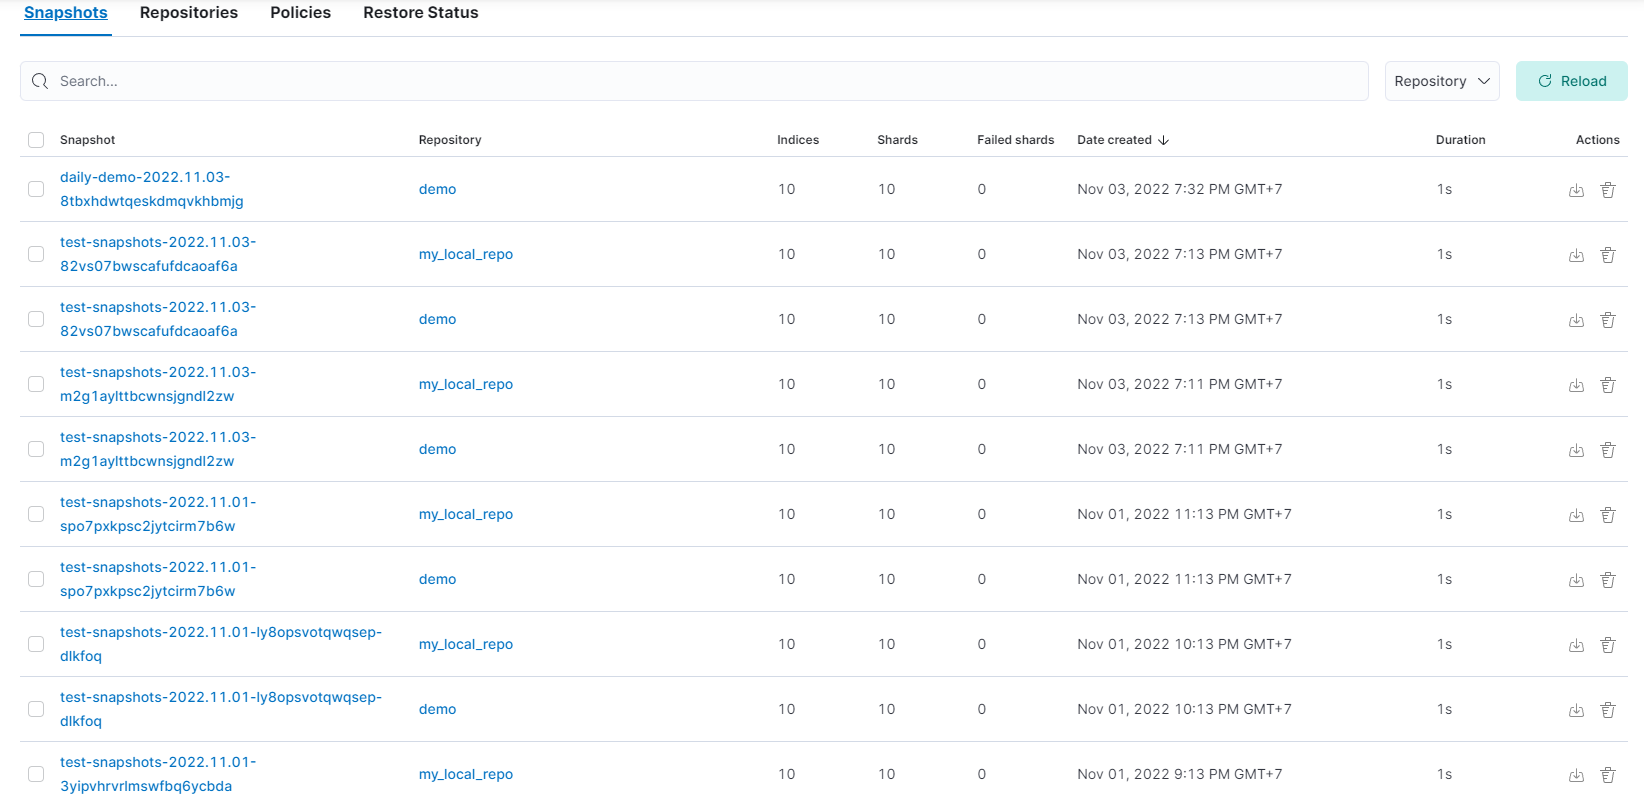
In the picture, there are many snapshots. Choose one.
- A pop-up shows up.
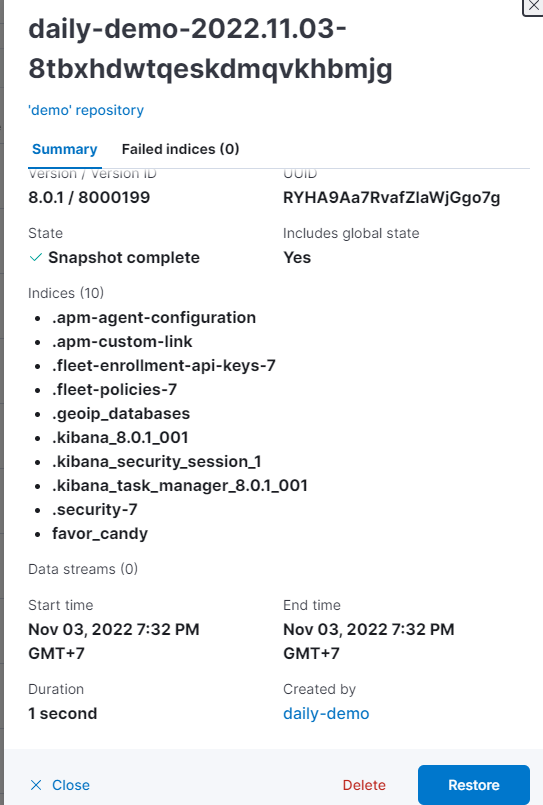
Then Restore.
- Pass 3 steps and select Restore snapshot.

But it refuses to restore because there are one same index named favor_candy in my node.

- Go to
Dev Tools-> type and run Delete favor_candy.
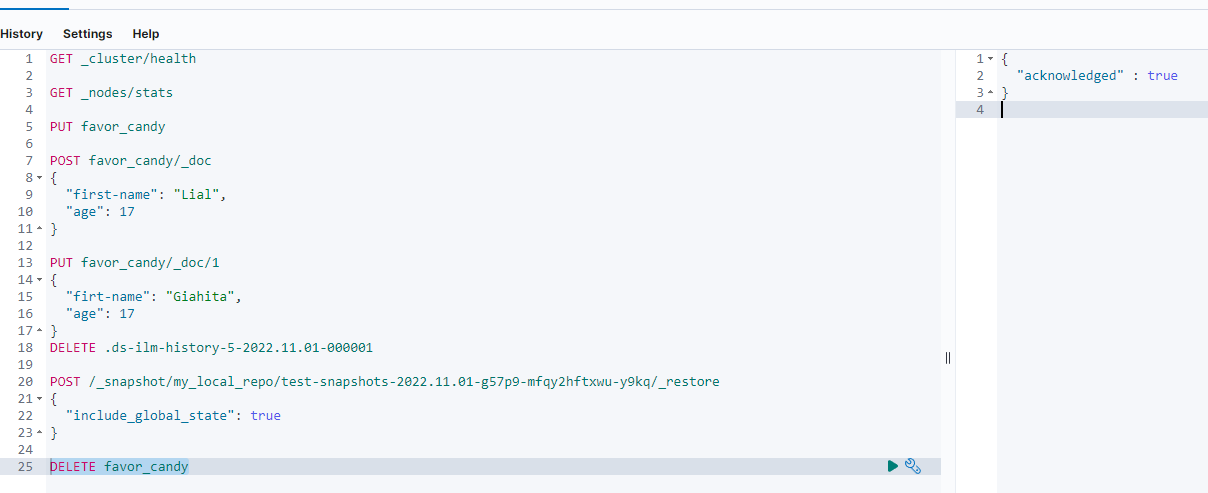
Note I could delete this index because the kibana_user created it and is permited to delete it. However, there are indices that can not be deleted unless kibanba_user is set to do it.
-
Do again step 2 and 3.
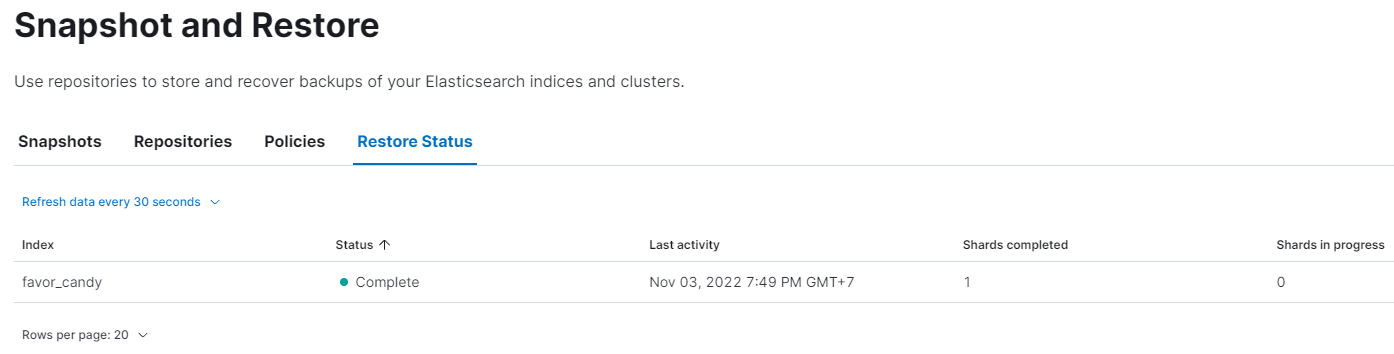
The successful restore should be looked like this: