


Angular wrapper for ApexCharts to build interactive visualizations in Angular.
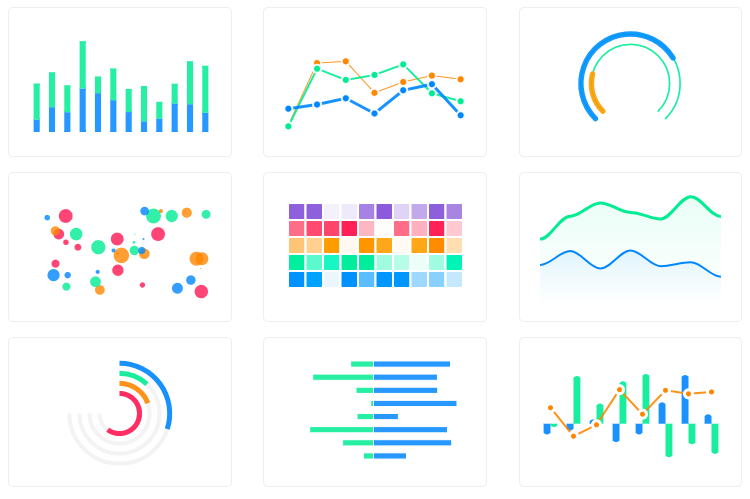
Everything here is standalone components and signals. There are no NgModules to register and no decorators in the public API.
- Standalone components: import
ChartComponentwhere you use it. - Signal inputs (
input()) and theoutput()API throughout. No@Input(),@Output(),@ViewChild(), orngOnChangesanywhere. - Zoneless ready: runs under
provideZonelessChangeDetection(), and the whole test suite is executed that way. ApexCharts' own rendering is kept outside the Angular zone so it never schedules change detection. OnPushchange detection, with chart creation scheduled viaafterNextRenderso layout is measured only once it is final.- SSR + hydration via
<apx-chart-ssr>/<apx-chart-hydrate>. - Tree-shakeable entry point via
<apx-chart-core>. chartInstanceis exposed as a signal, so you cancomputed()oreffect()off the underlying ApexCharts object.
| ng-apexcharts Version | Angular Version | ApexCharts Version |
|---|---|---|
| 3.1.x | 20+ | ^6.0.0 || ^7.0.0 |
| 3.0.x | 20+ | ^6.0.0 |
| 2.5.x | 20+ | ^5.10.3 || ^6.0.0 |
| 2.4.x | 20+ | ^5.10.3 || ^6.0.0 |
| 2.3.x | 20+ | ^5.10.3 |
| 2.2.x | 20+ | ^5.10.3 |
| 2.0.x - 2.1.x | 20+ | ^5.3.2 |
| 1.16.x - 1.17.x | 20.x | >=4.0.0 |
| 1.14.x - 1.15.x | 19.x | >=4.0.0 |
| 1.11.x - 1.13.x | 18.x | ^3.49.1 - ^4.0.0 |
| 1.9.x - 1.10.x | 17.x | ^3.45.2 |
| 1.7.x - 1.8.x | 13+ | ^3.40.0 - ^3.41.0 |
| 1.6.x | 9.x - 12.x | ^3.31.0 |
Note: For projects using older Angular versions (7-8), please use ng-apexcharts version 1.5.x or earlier.
ng-apexcharts 3.1+ works with ApexCharts 6 or 7. All option types (ApexChart,
ApexPlotOptions, and the rest) are re-exported directly from the installed
apexcharts package, so they always match its actual API
(#504).
ApexCharts 7 moved nine optional features out of its default bundle, so if you use one, import it alongside ApexCharts (this is an ApexCharts-level change, not an ng-apexcharts API change):
import 'apexcharts/features/trellis'The affected features are trellis, storyboard, perspectives, ink, renderer-canvas, link, measure, history and context-menu. Each warns in the console when its config is set but the feature is absent. If you must stay on ApexCharts 5.x, use ng-apexcharts 2.5.x; note that apexcharts 5.16.0 ships broken drilldown type declarations (#493).
ng add ng-apexchartsThat installs a compatible apexcharts release alongside the wrapper. Or do it
by hand:
npm install apexcharts ng-apexcharts --saveThere is nothing to add to angular.json and nothing to register in your
application config. The chart components load the ApexCharts bundle themselves
through a dynamic import(), so no global script tag is needed.
Upgrading? If an older
ng addputnode_modules/apexcharts/dist/apexcharts.min.jsinto thescriptsarray of yourangular.json, remove it. It is redundant, adds roughly 940 KB to every build, and prevents<apx-chart-core>from shrinking your bundle. Re-runningng add ng-apexchartscleans it up for you.
Import the component and use it in your template:
import { Component, signal } from "@angular/core";
import {
  ChartComponent,
  ApexAxisChartSeries,
  ApexChart,
  ApexXAxis,
  ApexTitleSubtitle,
} from "ng-apexcharts";

@Component({
  selector: "app-revenue-chart",
  imports: [ChartComponent],
  template: `
    <apx-chart
      [series]="series()"
      [chart]="chart"
      [xaxis]="xaxis"
      [title]="title"
    />
  `,
})
export class RevenueChartComponent {
  readonly series = signal<ApexAxisChartSeries>([
    { name: "Revenue", data: [10, 41, 35, 51, 49, 62, 69, 91, 148] },
  ]);

  readonly chart: ApexChart = { type: "bar", height: 350 };
  readonly title: ApexTitleSubtitle = { text: "Monthly Revenue" };
  readonly xaxis: ApexXAxis = {
    categories: ["Jan", "Feb", "Mar", "Apr", "May", "Jun", "Jul", "Aug", "Sep"],
  };
}
You need at least series and chart for a meaningful chart.
Set a new value on the signal (or change the bound input) and the chart updates
itself. There is no need to call updateSeries() or updateOptions() manually:
addMonth() {
  this.series.update((current) => [
    { ...current[0], data: [...current[0].data, 120] },
  ]);
}
Changing only series runs the cheap updateSeries() path, which animates
in place and keeps the same chart instance. Changing any other option rebuilds
the chart. If both change together, the rebuild wins and happens once.
Set [autoUpdateSeries]="false" to opt out of the in-place series update and
always rebuild. This matters for mixed/combo charts where you change the type
inside the series objects themselves.
Each input maps to the matching key of the ApexCharts config object. All are
signal inputs, so read them with chart() in your own code:
| Input | Type |
|---|---|
chart |
ApexChart |
series |
ApexAxisChartSeries | ApexNonAxisChartSeries |
annotations |
ApexAnnotations |
colors |
any[] |
dataLabels |
ApexDataLabels |
stroke |
ApexStroke |
labels |
string[] |
legend |
ApexLegend |
markers |
ApexMarkers |
noData |
ApexNoData |
parsing |
ApexParsing |
fill |
ApexFill |
tooltip |
ApexTooltip |
plotOptions |
ApexPlotOptions |
responsive |
ApexResponsive[] |
xaxis |
ApexXAxis |
yaxis |
ApexYAxis | ApexYAxis[] |
forecastDataPoints |
ApexForecastDataPoints |
grid |
ApexGrid |
states |
ApexStates |
title |
ApexTitleSubtitle |
subtitle |
ApexTitleSubtitle |
theme |
ApexTheme |
autoUpdateSeries |
boolean (default true) |
See the ApexCharts docs for what each option accepts.
| Member | Type | Description |
|---|---|---|
chartReady |
output<{ chartObj: ApexCharts }> |
Emits after each successful render. |
chartInstance |
Signal<ApexCharts | null> |
The live ApexCharts object, or null before it exists. |
Because chartInstance is a signal, you can react to it declaratively:
import { Component, computed, viewChild } from "@angular/core";
import { ChartComponent } from "ng-apexcharts";

@Component({
  imports: [ChartComponent],
  template: `<apx-chart [series]="series" [chart]="chart" />`,
})
export class DashboardComponent {
  private readonly chartCmp = viewChild.required(ChartComponent);

  readonly isRendered = computed(() => this.chartCmp().chartInstance() !== null);
}Every method is proxied through the component, so you never need to touch the
DOM. Grab the component with viewChild and call it:
import { Component, viewChild } from "@angular/core";
import { ChartComponent } from "ng-apexcharts";

@Component({
  imports: [ChartComponent],
  template: `
    <apx-chart [series]="series" [chart]="chart" />
    <button (click)="toggle()">Toggle</button>
  `,
})
export class DashboardComponent {
  private readonly chart = viewChild.required(ChartComponent);

  toggle() {
    this.chart().toggleSeries("Revenue");
  }
}
Available methods: render, updateOptions, updateSeries, appendSeries,
appendData, highlightSeries, toggleSeries, showSeries, hideSeries,
resetSeries, zoomX, toggleDataPointSelection, destroy, setLocale,
paper, addXaxisAnnotation, addYaxisAnnotation, addPointAnnotation,
removeAnnotation, clearAnnotations, dataURI.
Reference for the underlying behaviour lives in the ApexCharts methods docs.
To reach a chart from somewhere else entirely, use the global exec() and
target the chart by its chart.id:
window.ApexCharts.exec("ng-chart-example", "updateSeries", [
  { data: [40, 55, 65, 11, 23, 44, 54, 33] },
]);
The component assigns window.ApexCharts when it loads its bundle, so this
works without a global script tag. More on
.exec().
Use <apx-chart-core> instead of <apx-chart> to load the ApexCharts core
bundle (~611 KB gzipped) instead of the full bundle (~942 KB). Register only the
chart types you need with side-effect imports:
import "apexcharts/line";             // line, area, scatter, bubble
import "apexcharts/bar";              // bar, column, rangeBar
import "apexcharts/features/legend";  // opt-in legend
import "apexcharts/features/toolbar"; // opt-in toolbar
import { ChartCoreComponent } from "ng-apexcharts";
@Component({
imports: [ChartCoreComponent],
template: `<apx-chart-core [chart]="chart" [series]="series" />`,
})
export class LeanChartComponent {}All inputs, outputs, and methods are identical to <apx-chart>.
ng-apexcharts supports Angular SSR out of the box via two companion components.
import { ChartSSRComponent } from "ng-apexcharts";

@Component({
  imports: [ChartSSRComponent],
  template: `<apx-chart-ssr [options]="chartOptions" [width]="800" [height]="400" />`,
})
export class StaticChartComponent {}
The options input accepts a single ApexOptions object (all chart config combined).
Place it immediately after <apx-chart-ssr> in the same container:
<apx-chart-ssr [options]="chartOptions" />
<apx-chart-hydrate [clientOptions]="{ chart: { animations: { enabled: true } } }" />
clientOptions is merged by ApexCharts during hydration and can be used to
override options that only make sense in the browser (animations, tooltips, etc.).
Injectable service for generating chart HTML or SVG strings on the server:
import { ChartSSRService } from "ng-apexcharts";

const html = await chartSSRService.renderToHTML(options, { width: 800, height: 400 });
const svg = await chartSSRService.renderToString(options, { width: 800, height: 400 });New code should import the standalone components directly. If your application
is still NgModule-based, NgApexchartsModule re-exports all four components:
import { NgApexchartsModule } from "ng-apexcharts";

@NgModule({
  imports: [NgApexchartsModule],
})
export class AppModule {}
It exists only for backwards compatibility. Do not add it to a standalone
application's providers via importProvidersFrom(): it declares no providers,
so that has no effect and leaves <apx-chart> unresolved in your templates.
More than 80+ examples of all the chart types with sample code are on the Angular Demos page.