



QuantStats Pro is an actively maintained drop-in replacement for QuantStats — same import quantstats as qs, hardened metrics, and a product roadmap that goes well beyond the original scope.
Where original quantstats stops at classic performance stats and a single HTML tearsheet, Pro is built to become a definitive quantitative analytics stack: advanced risk engines, new metrics, institutional-grade reports, and outputs designed to drive actionable decisions, not just describe the past.
Built for systematic traders, portfolio managers, and quant researchers who need production-grade tearsheets from a returns series.
pip install quantstats-proimport quantstats as qsNote: QuantStats Pro cannot coexist with the original
quantstatspackage in the same environment — both provide thequantstatsimport namespace. Uninstallquantstatsbefore installingquantstats-pro(pip uninstall quantstats).
Changelog » · Upstream » · Contributing »
Same API surface, stronger foundation — bugfixes, reliability, and a growing analytics layer that upstream does not aim to provide.
Headline additions (v0.3.0+):
| Capability | What you get |
|---|---|
html_simple |
Lean equity-curve tearsheet — fast read on performance vs benchmark |
html_montecarlo |
Multi-model forward risk report (GBM, GARCH, Heston, bootstraps, Bayesian, …) with bust/goal probabilities and cross-model consensus |
html_alpha_decay |
Rolling alpha-decay monitor — z-score traffic lights, CUSUM, time-underwater, per-metric distribution charts |
quantstats.montecarlo |
Programmatic multi-model simulation engine behind the Montecarlo tearsheet |
quantstats.alphadecay |
Short-horizon rolling diagnostics engine behind the Alpha Decay tearsheet |
Classic html |
Full tearsheet — metrics + all charts, visually redesigned (v0.2.0+) |
| Module | Purpose |
|---|---|
quantstats.stats |
50+ performance metrics (Sharpe, Sortino, drawdown, VaR, …) |
quantstats.plots |
Performance visualizations (returns, drawdown, heatmaps, rolling stats, …) |
quantstats.reports |
HTML tearsheets and metrics tables |
quantstats.montecarlo |
Multi-model forward simulation engine and analytics |
quantstats.alphadecay |
Short-horizon rolling risk analysis and decay detection |
quantstats.utils |
Data prep, download_returns, pandas helpers |
Legacy shuffle-based Montecarlo remains at qs.stats.montecarlo() for backward compatibility. The new engine lives under quantstats.montecarlo and powers qs.reports.html_montecarlo().
The main product surface in QuantStats Pro is its reporting layer: four HTML tearsheet types that turn a returns series into shareable, browser-ready analytics. All open in the browser by default, or save to disk with output="path.html".
| Function | Use case |
|---|---|
qs.reports.html(...) |
Full classic tearsheet (metrics + all charts) |
qs.reports.html_simple(...) |
Pro-only — lean equity-curve tearsheet for quick strategy review |
qs.reports.html_montecarlo(...) |
Pro-only — multi-model forward risk analysis (1y horizon by default) |
qs.reports.html_alpha_decay(...) |
Pro-only — short-window alpha-decay health monitor (7/15/30d) |
Focused equity-curve view with core metrics and charts. Ideal when you need a clean performance read without the full classic layout.
qs.reports.html_simple(returns, benchmark="SPY", output="qqq_simple.html")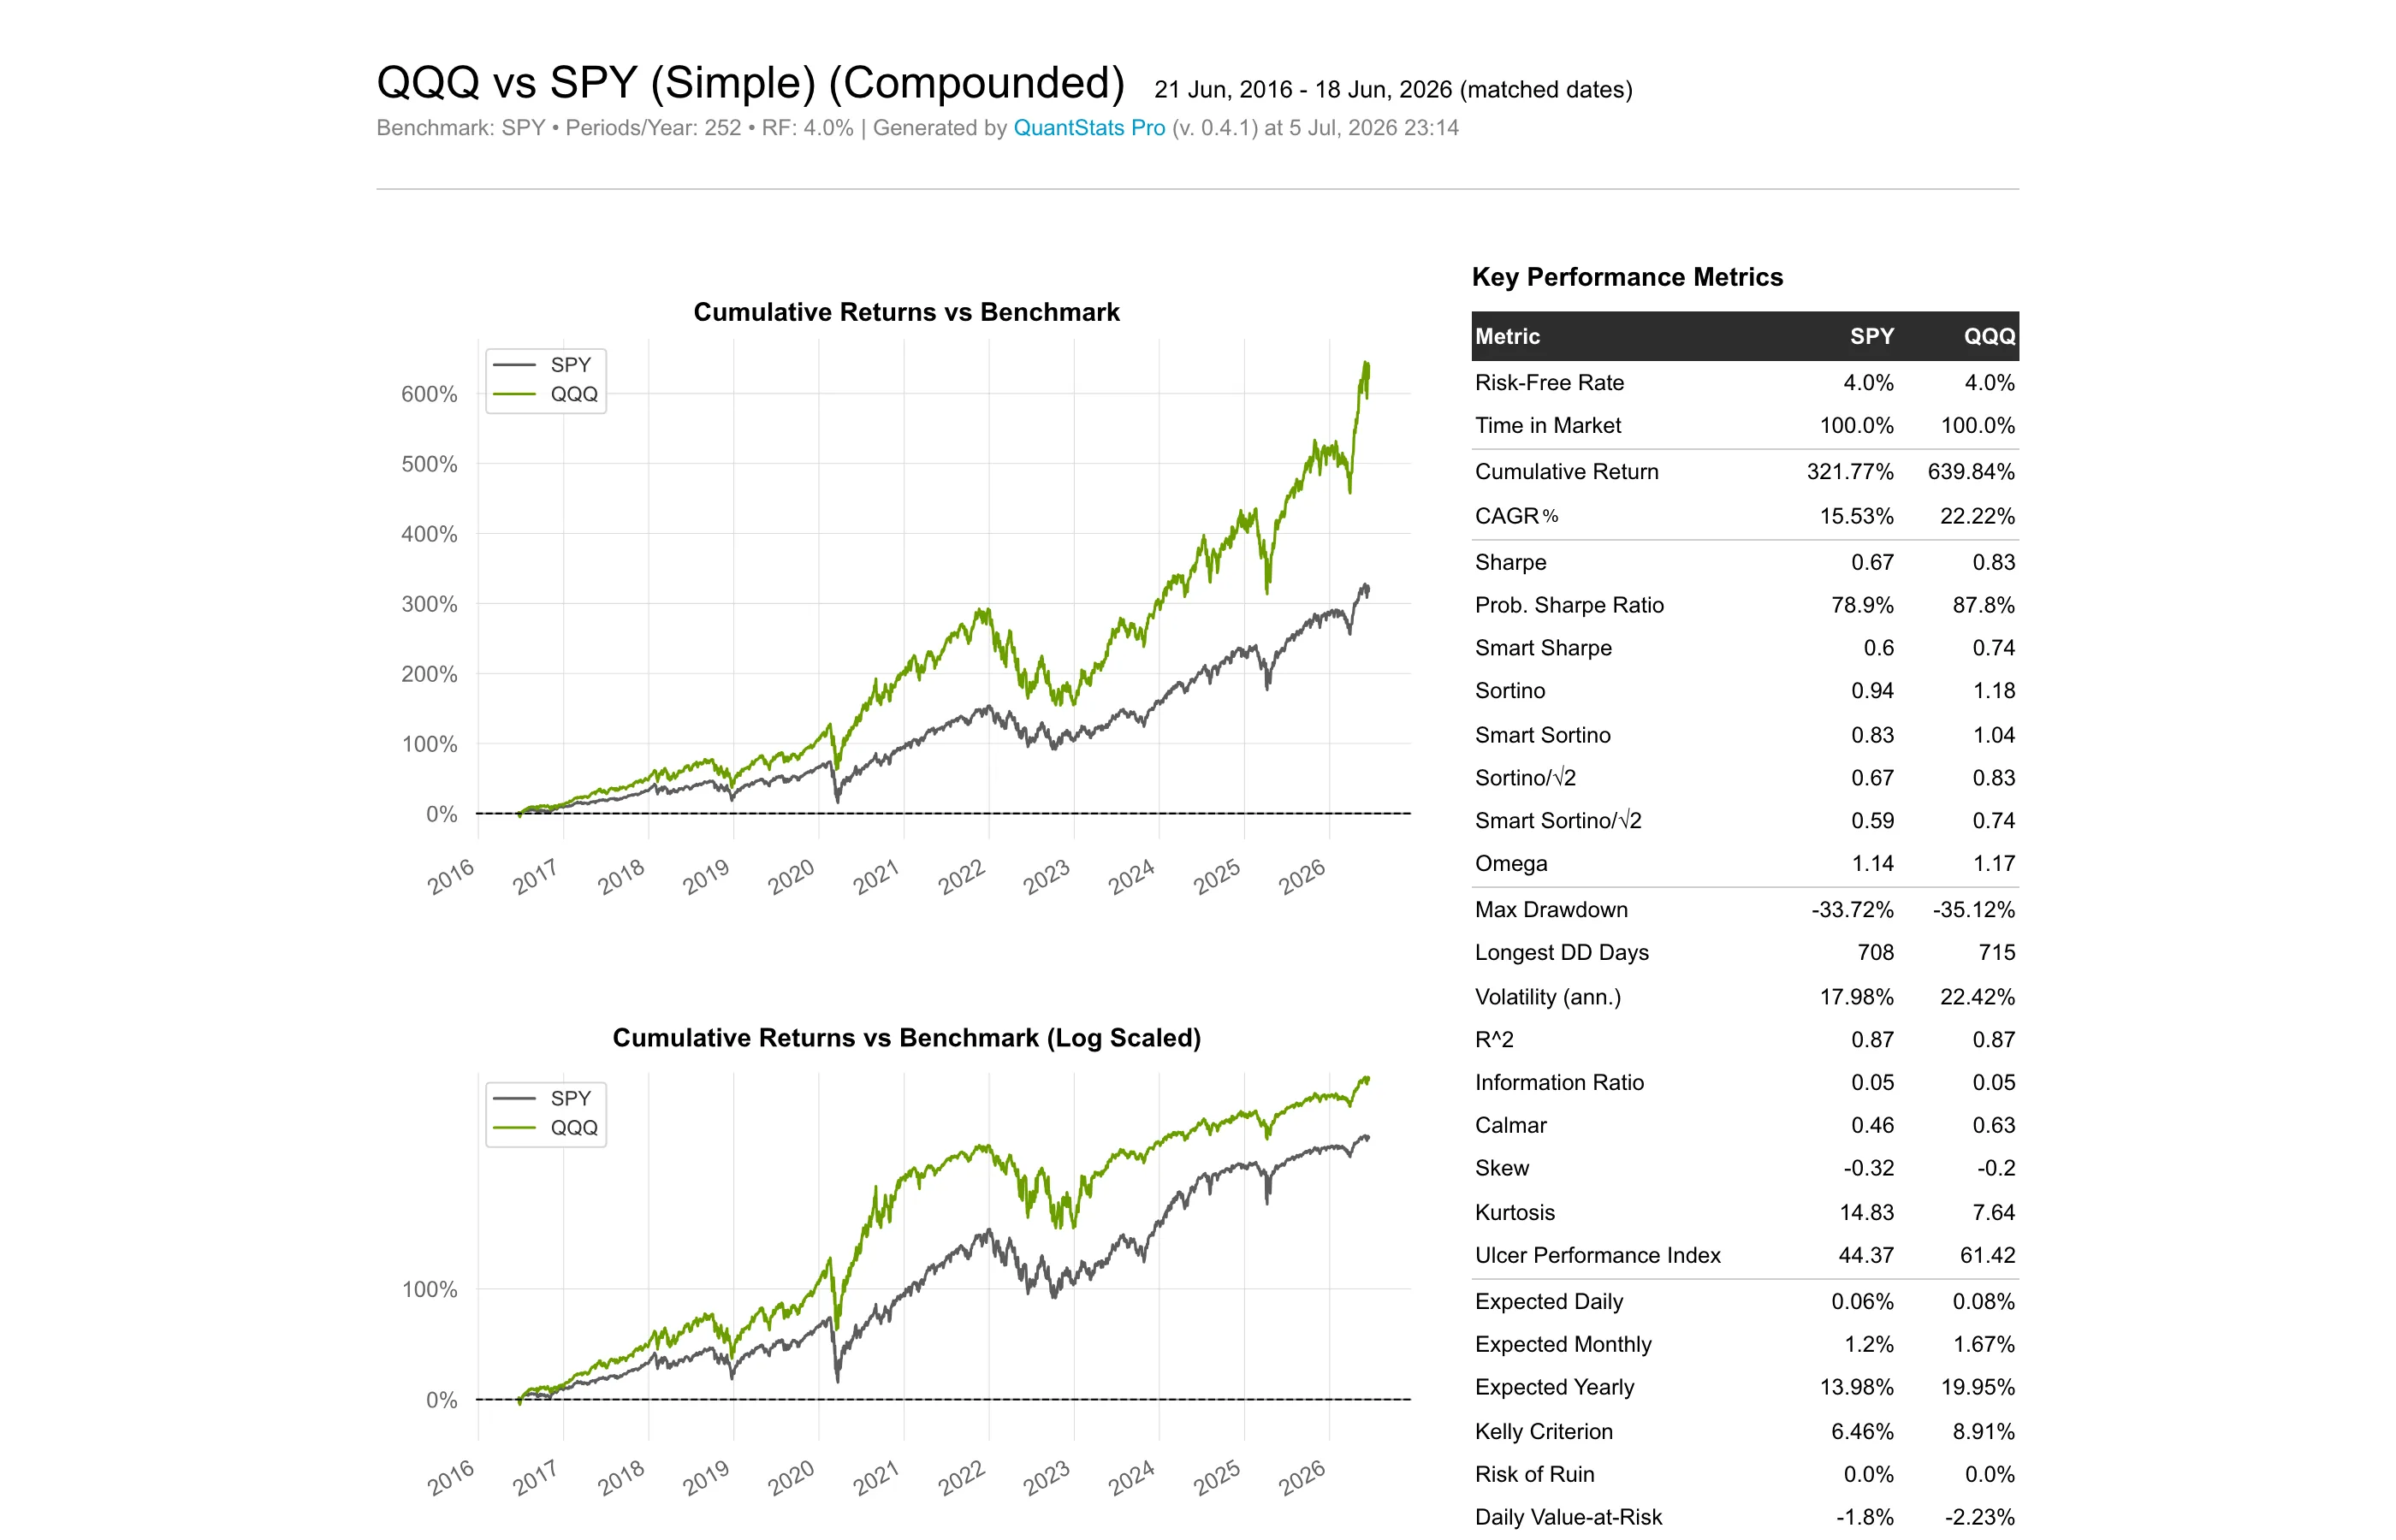
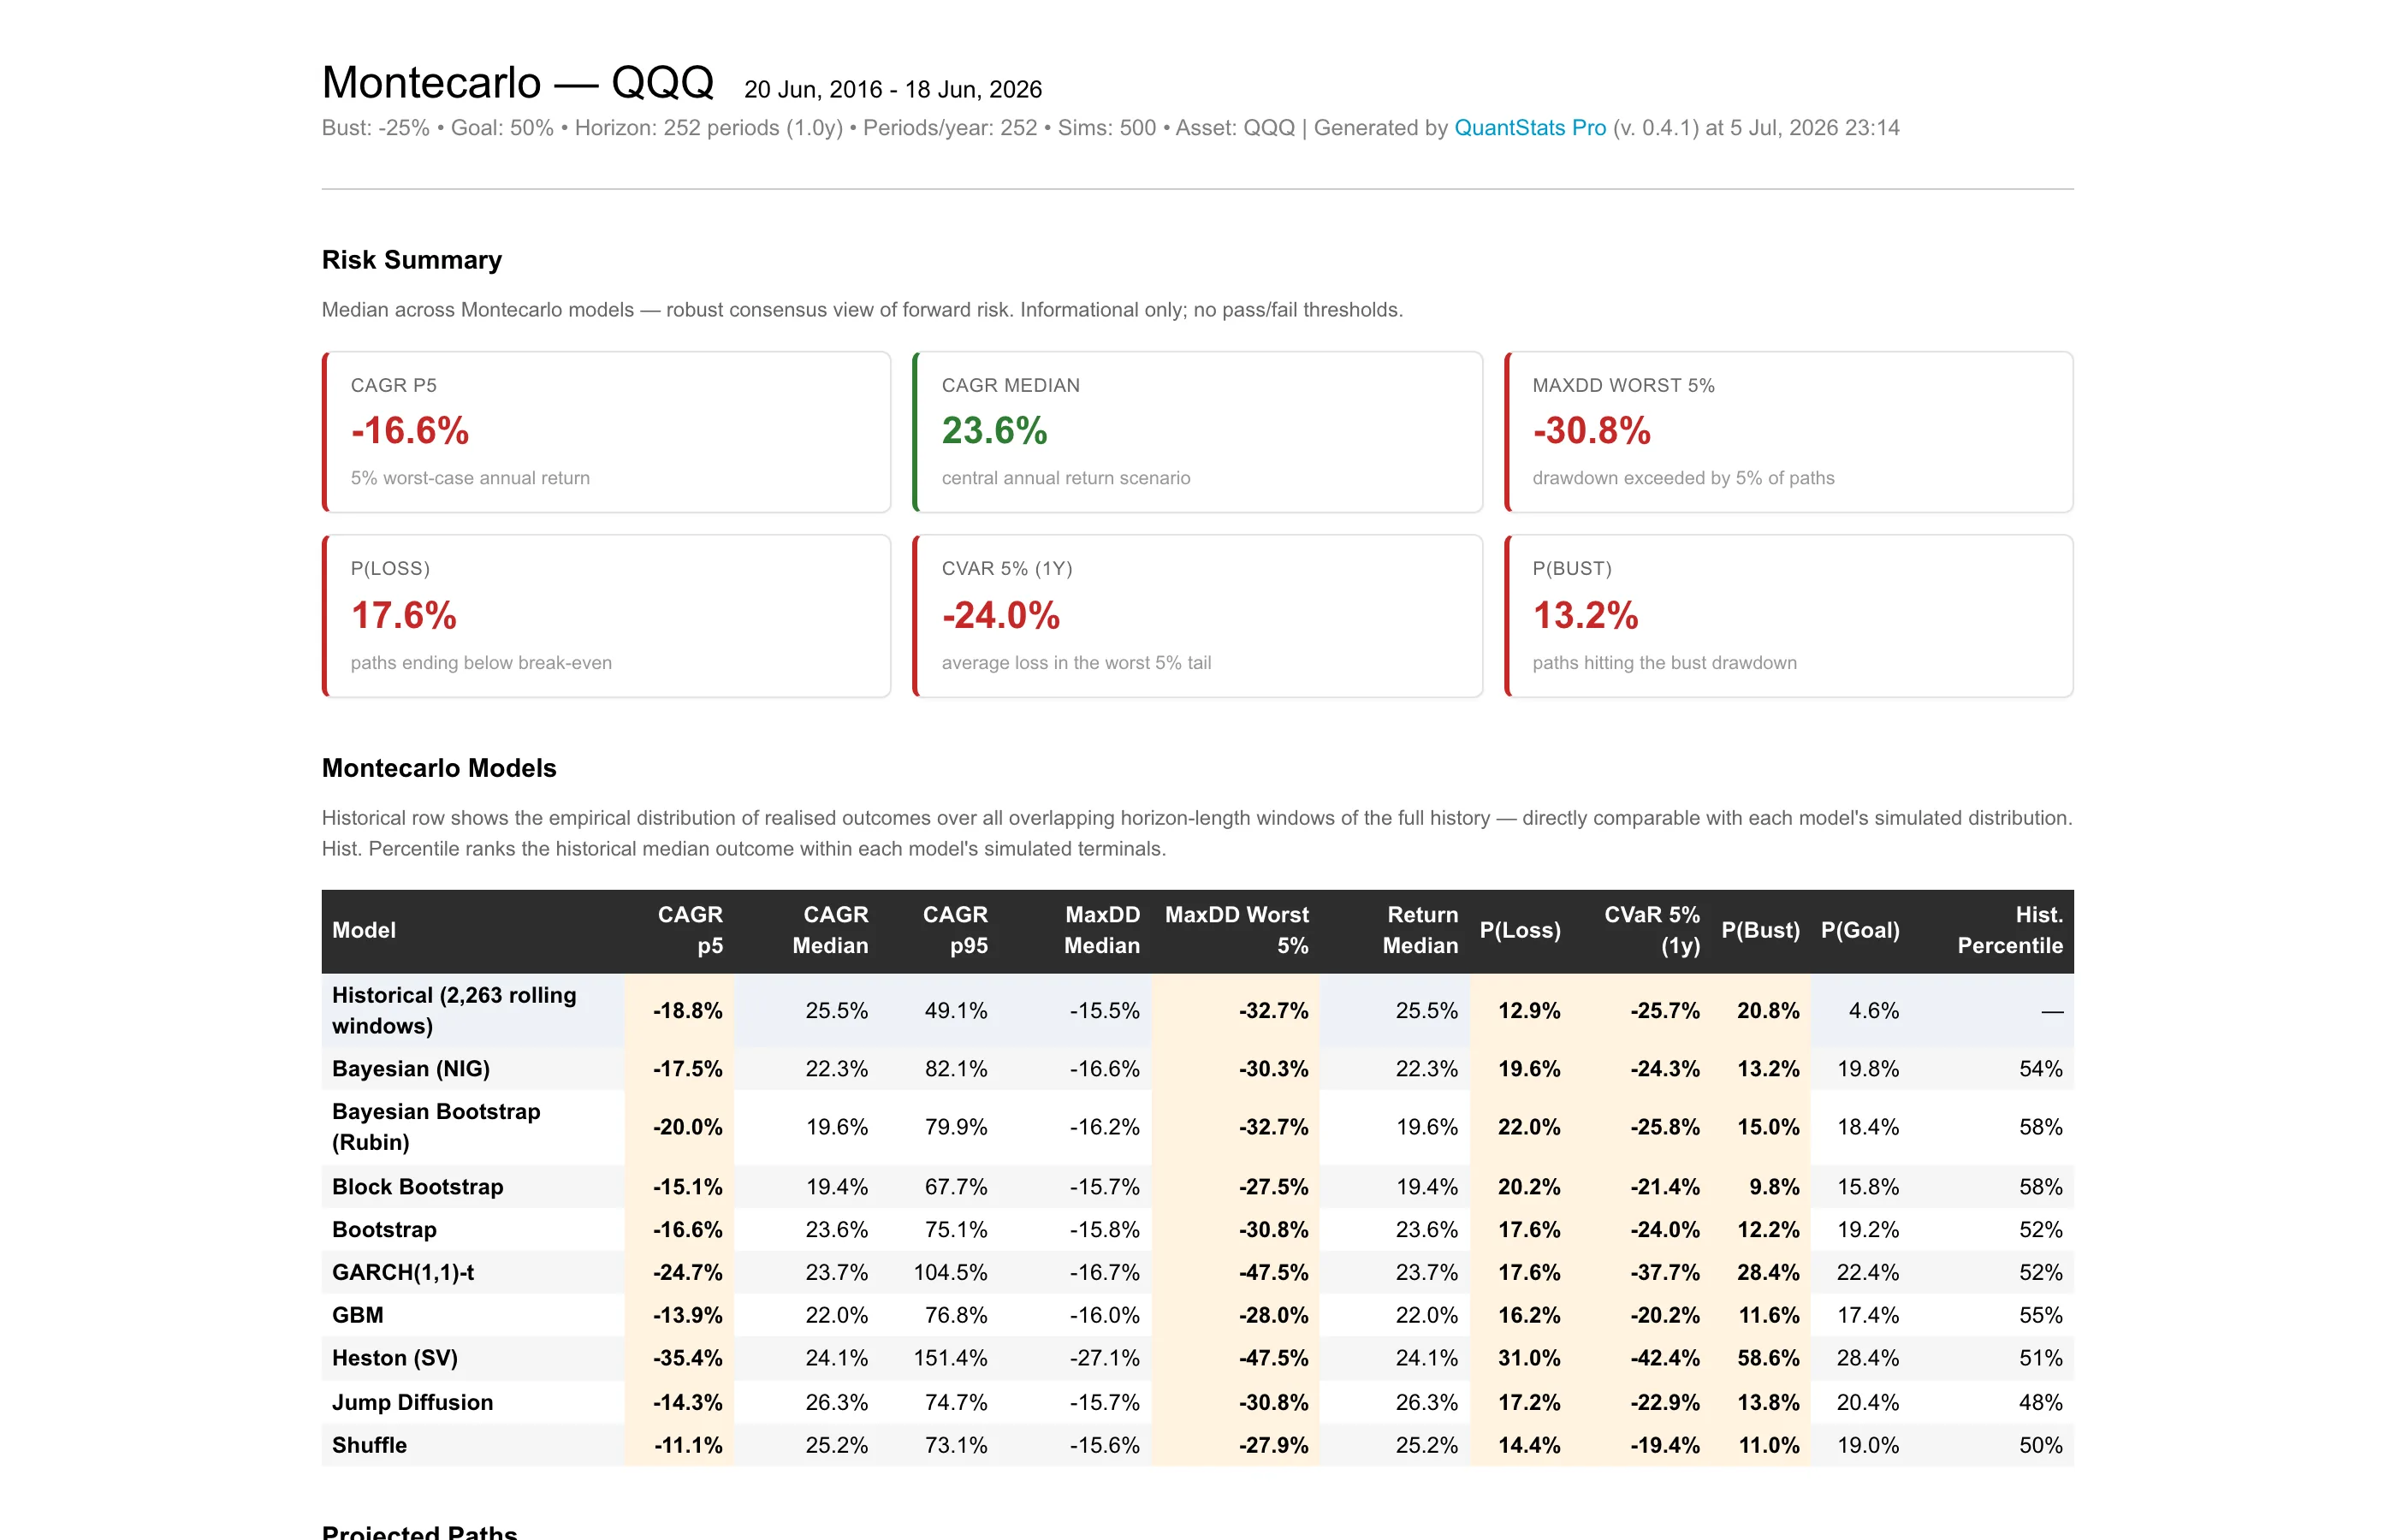
Runs multiple stochastic models in parallel, surfaces bust/goal probabilities, cross-model consensus, and a stress envelope — forward-looking risk in one report.
qs.reports.html_montecarlo(
    returns,
    bust=-0.25,   # P(Bust): drawdown threshold
    goal=0.50,    # P(Goal): terminal return target
    sims=500,
    seed=42,
    output="qqq_montecarlo.html",
)
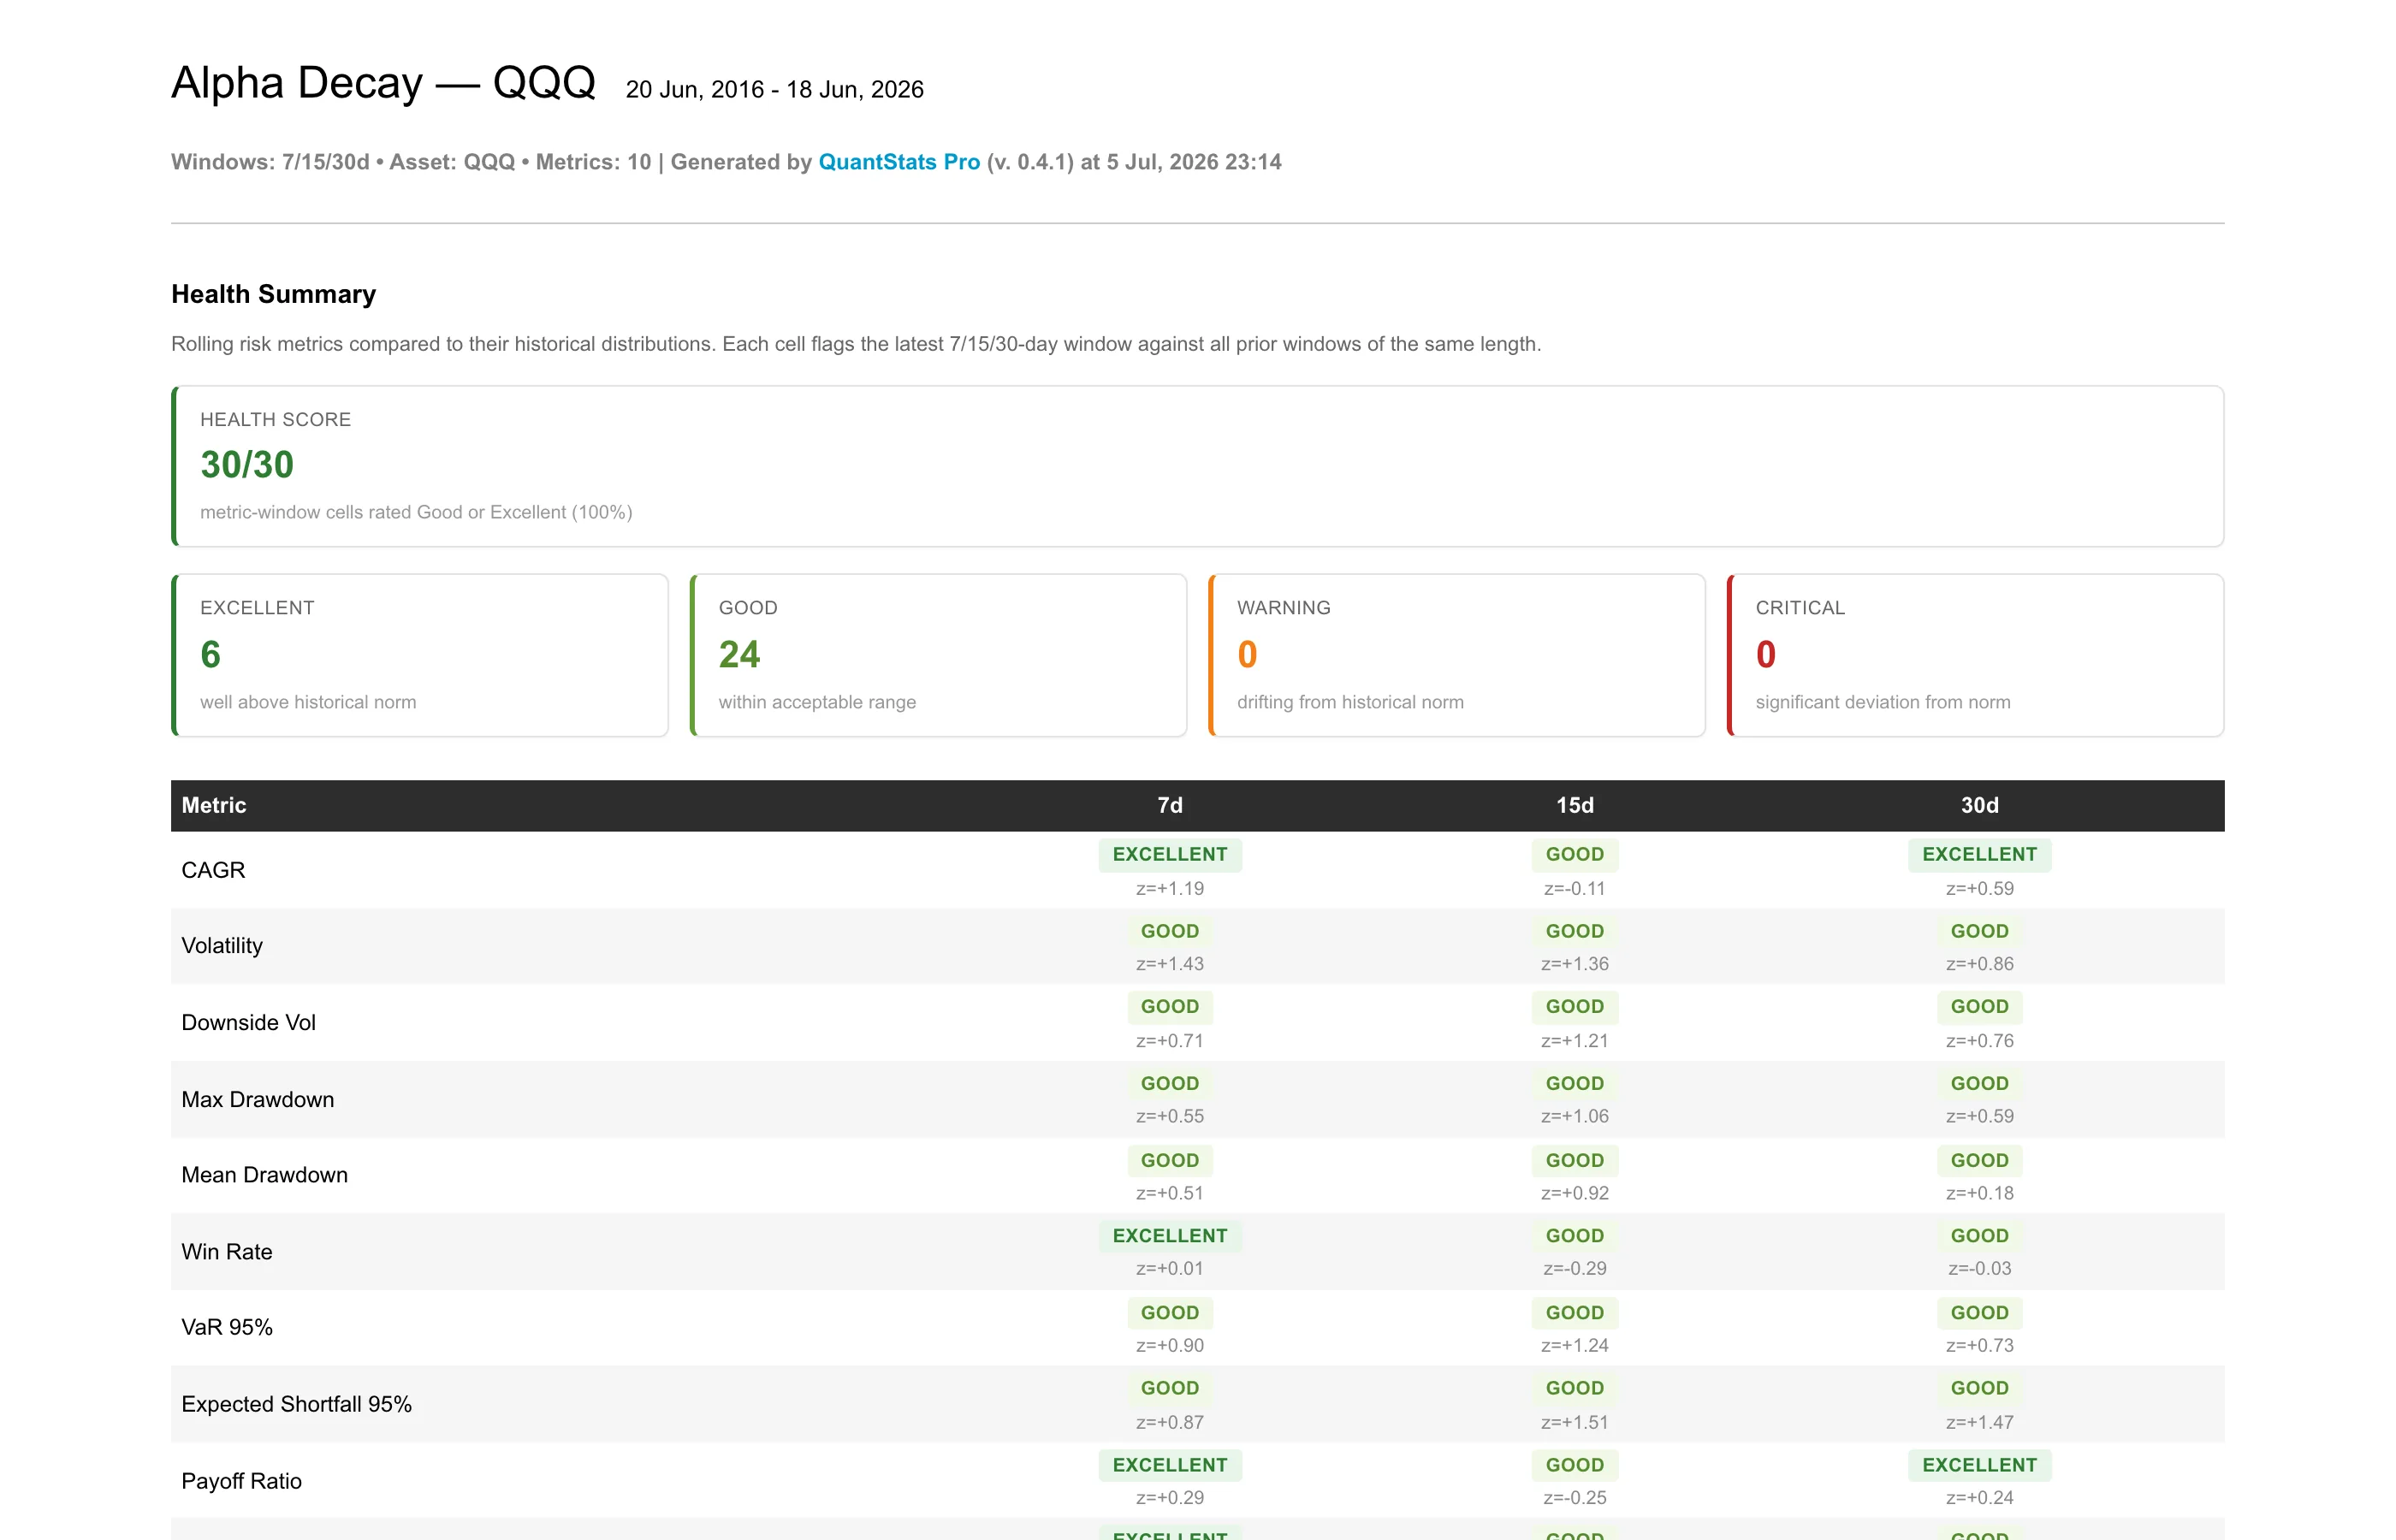
Rolling-window monitor for short-horizon drift: 10 metrics × 7/15/30-day windows, z-score traffic lights, CUSUM decay detection, and time-underwater analysis.
qs.reports.html_alpha_decay(
    returns,
    windows=(7, 15, 30),
    output="qqq_alpha_decay.html",
)
The original QuantStats report — all metrics and charts, visually redesigned in v0.2.0+.
qs.reports.html(returns, benchmark="SPY", output="qqq_full.html")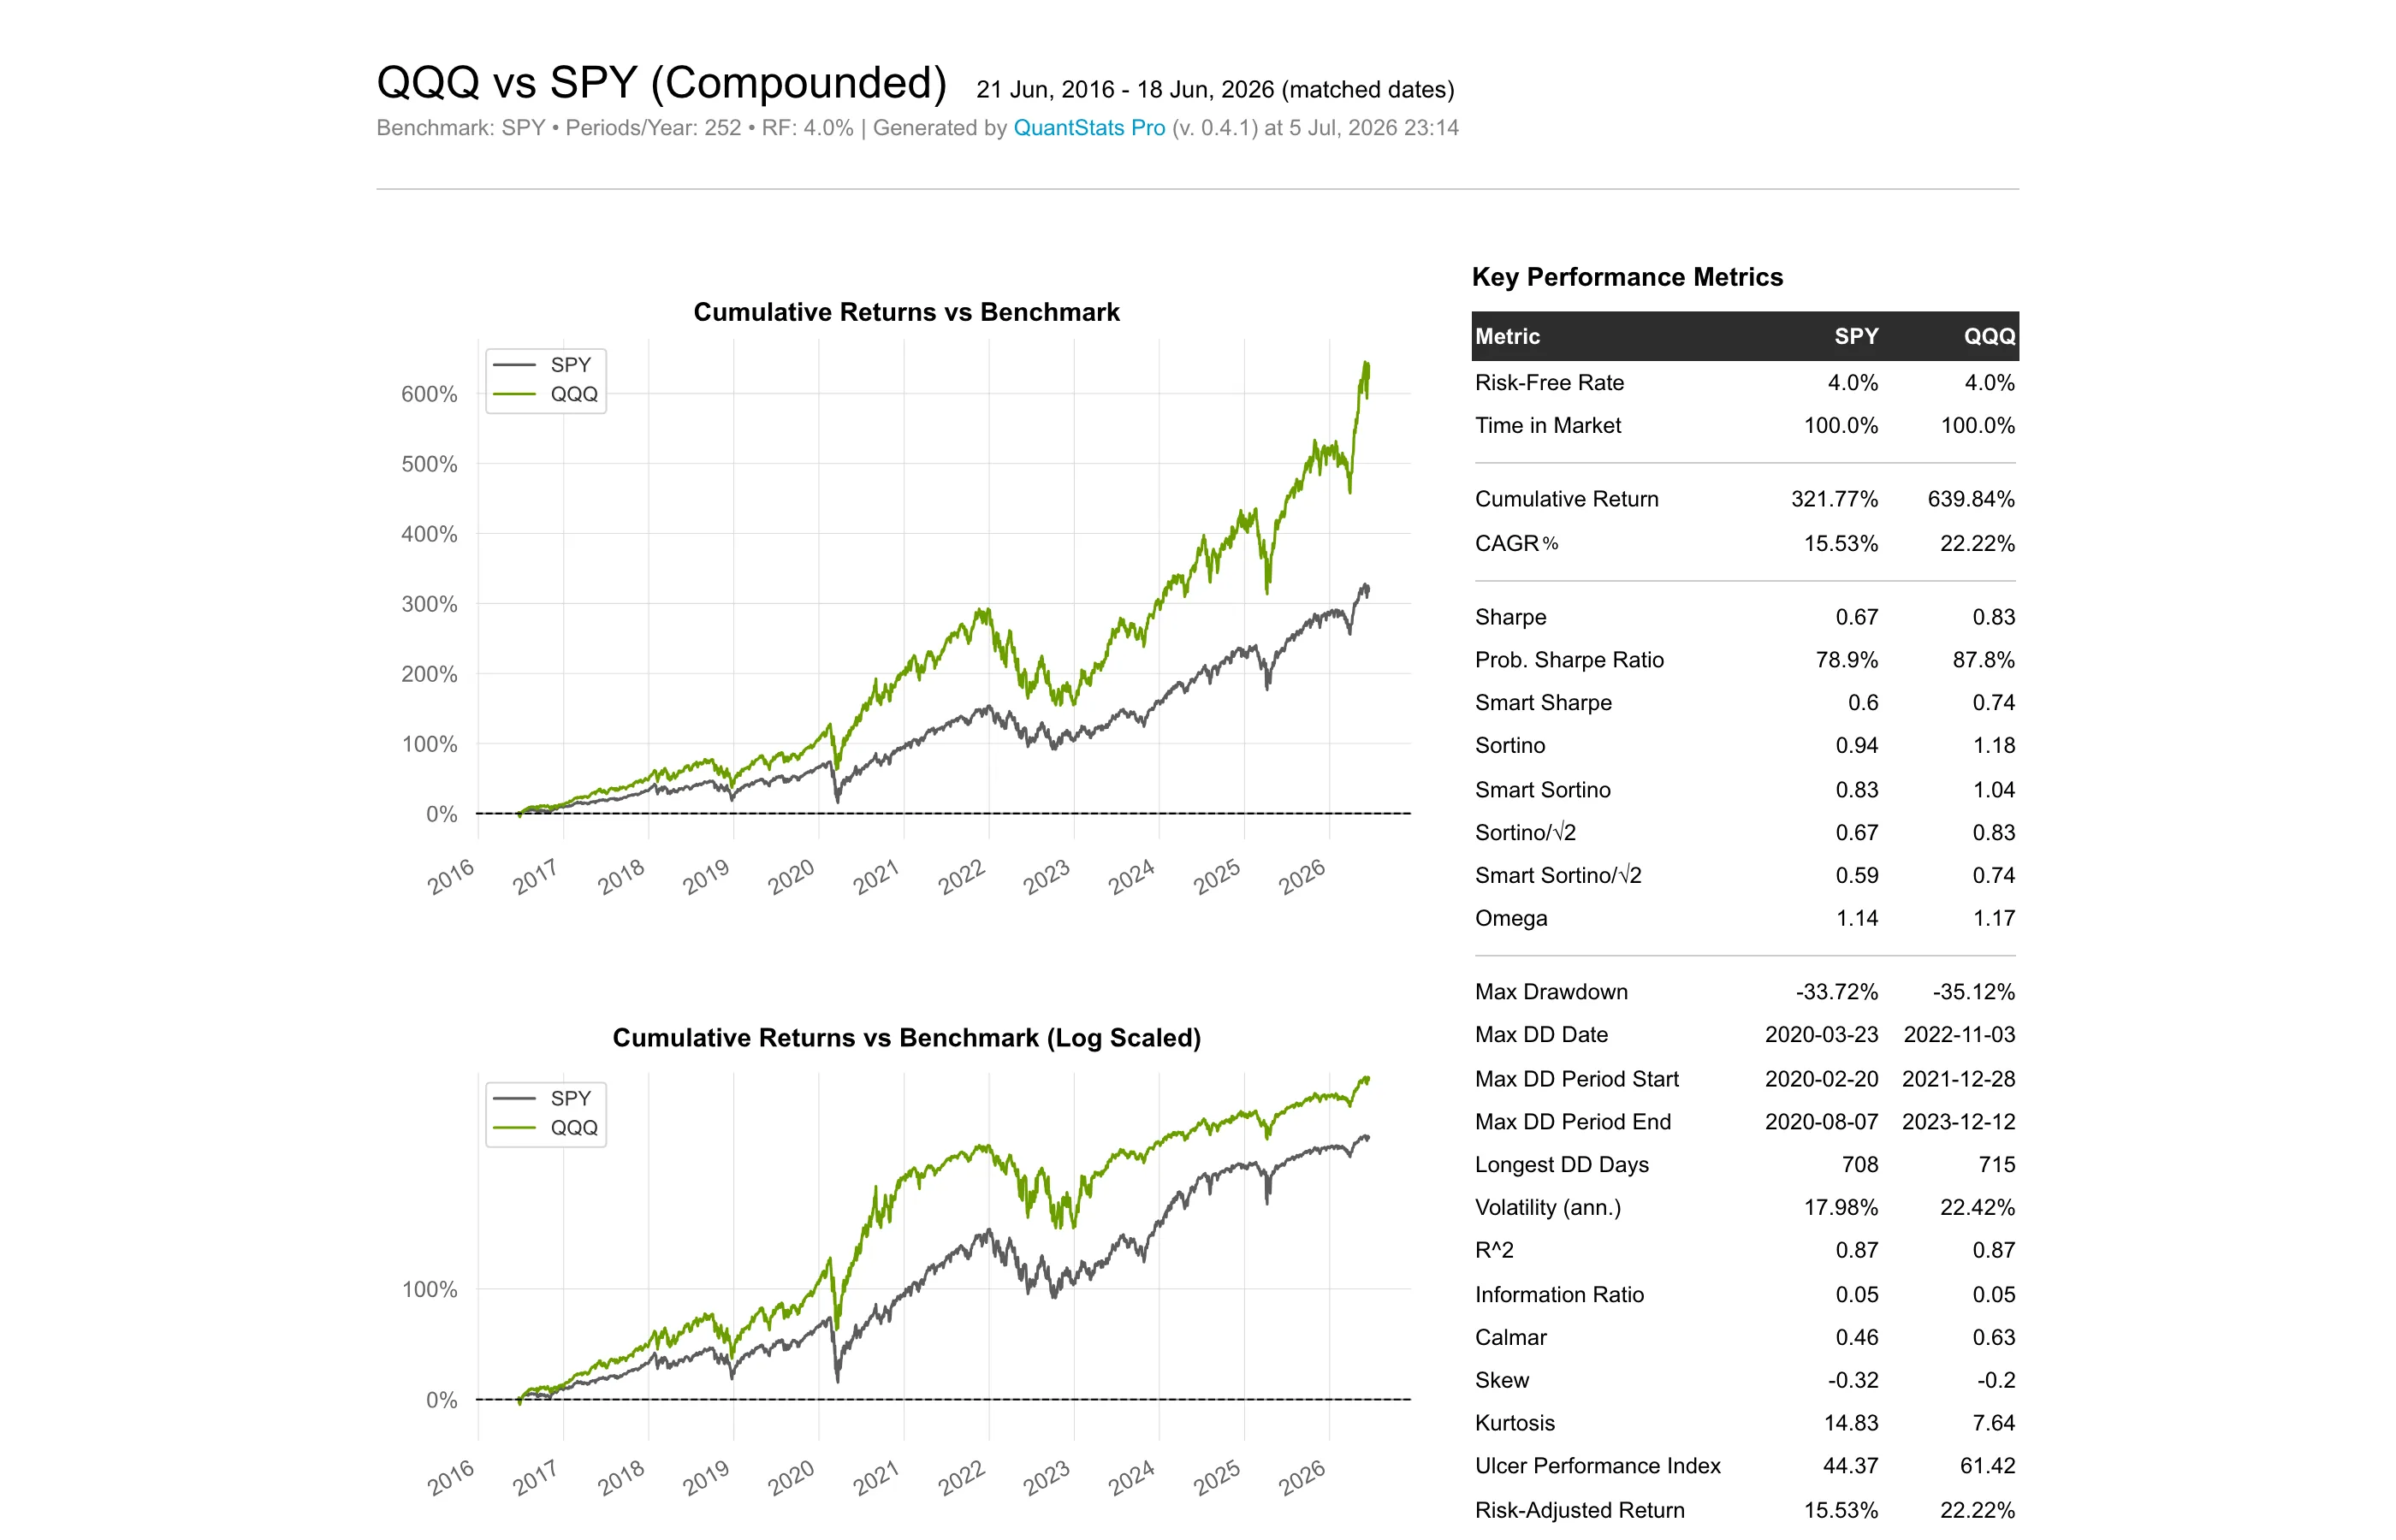
View interactive classic sample · Montecarlo docs · Alpha Decay docs
import quantstats as qs

qs.extend_pandas()
returns = qs.utils.download_returns("QQQ")

# Single metric
qs.stats.sharpe(returns)
returns.sharpe()  # via extend_pandas()

# Snapshot plot
qs.plots.snapshot(returns, title="QQQ Performance", show=True)

# HTML tearsheet vs benchmark
qs.reports.html(returns, "SPY", output="qqq_report.html")
qs.reports.html_simple(returns, "SPY", output="qqq_simple.html")
qs.reports.html_montecarlo(returns, output="qqq_montecarlo.html")
qs.reports.html_alpha_decay(returns, output="qqq_alpha_decay.html")
See HTML Tearsheets above for screenshots and parameter details.
For daily crypto data, pass periods_per_year=365 to reports and stats that annualize:
returns = qs.utils.download_returns("BTC-USD")
qs.reports.html(returns, periods_per_year=365, output="btc_report.html")
qs.stats.sharpe(returns, periods=365)quantstats.montecarlo characterises an asset with several stochastic models, simulates forward paths from each, and compares the distribution of outcomes (CAGR, max drawdown, bust/goal probabilities, CVaR).
| Model | Name | Category |
|---|---|---|
| GBM | gbm |
Montecarlo |
| Shuffle (legacy) | shuffle |
Montecarlo |
| Bootstrap | bootstrap |
Montecarlo |
| Block Bootstrap | block_bootstrap |
Montecarlo |
| Jump Diffusion (Merton) | jump_diffusion |
Montecarlo |
| GARCH(1,1)-t | garch |
Montecarlo |
| Heston (SV) | heston |
Montecarlo |
| Bayesian (NIG) | bayesian |
Montecarlo |
| Bayesian Bootstrap | bayesian_bootstrap |
Montecarlo |
| Trimmed Bootstrap (top 1%) | trimmed_1pct |
Stress |
from quantstats.montecarlo import run_models, available_models
from quantstats.montecarlo import analytics as mca

print(available_models())
# ['bayesian', 'bayesian_bootstrap', 'block_bootstrap', 'bootstrap', ...]

results = run_models(
    returns,
    models=["gbm", "garch", "bootstrap"],
    horizon=252,      # 1 year (default: periods_per_year)
    sims=1000,
    bust=-0.25,
    goal=0.50,
    seed=42,
)

# Per-model summary row
gbm = results["gbm"]
print(gbm.summary)          # cagr_p5, cagr_median, maxdd_p95, prob_loss, cvar_5, …
print(gbm.sim_returns.shape)  # (horizon, sims)

# Cross-model consensus and stress envelope
median = mca.model_median_summary(results)
envelope = mca.conservative_envelope(results)
hist = mca.historical_summary(returns, horizon=252)The original upstream API still works — random permutation of historical returns:
mc = qs.stats.montecarlo(returns, sims=1000, bust=-0.20, goal=0.50, seed=42)
print(f"Bust probability: {mc.bust_probability:.1%}")
print(f"Goal probability: {mc.goal_probability:.1%}")
mc.plot()
Full Montecarlo documentation »
quantstats.alphadecay tracks whether a strategy's short-term risk profile is drifting from its historical norm. It computes 10 rolling metrics over configurable windows (default 7/15/30 days):
CAGR · Volatility · Downside Vol · Max Drawdown · Mean Drawdown · Win Rate · VaR 95% · Expected Shortfall 95% · Payoff Ratio · Skew
Each metric-window cell gets a traffic-light status (Excellent / Good / Warning / Critical) based on z-scores computed on a per-metric analysis scale (log transforms for skewed metrics). The tearsheet also includes:
- Health score — count of Good/Excellent cells
- CUSUM return-decay detector
- Time underwater duration analysis
- Per-metric distribution charts with current observation vs historical mean
from quantstats.alphadecay import analyze, available_metrics

print(available_metrics())
# ['cagr', 'volatility', 'downside_vol', 'max_drawdown', ...]

result = analyze(
    returns,
    windows=(7, 15, 30),
    rf=0.0,
    periods=252,
)

print(f"Health: {result.score}/{result.total} ({result.score_pct:.0f}%)")

for metric in result.metrics:
    wr = metric.windows[30]  # latest 30-day window
    print(f"{metric.spec.label}: z={wr.z_score:+.2f} → {wr.status}")
Generate the full HTML tearsheet with qs.reports.html_alpha_decay(returns).
QuantStats Pro exposes 50+ stats, 15+ plot types, and 4 HTML report generators. Explore the full API interactively:
[f for f in dir(qs.stats) if not f.startswith("_")]
[f for f in dir(qs.plots) if not f.startswith("_")]
help(qs.stats.sharpe)
Notebook / console helpers:
qs.reports.metrics(returns, mode="full")   # metrics table
qs.reports.plots(returns, mode="full")     # all plots
qs.reports.basic(returns)                  # basic metrics + plots
qs.reports.full(returns)                   # full metrics + plots
See Montecarlo documentation and help(qs.stats.<method>) for parameter details.
QuantStats analyzes return series (daily, weekly, monthly returns), not discrete trade data. This means:
- Win Rate = percentage of periods with positive returns
- Consecutive Wins/Losses = consecutive positive/negative return periods
- Payoff Ratio = average winning period return / average losing period return
- Profit Factor = sum of positive returns / sum of negative returns
These metrics are valid and useful for systematic strategies, return-series analysis, and period-by-period comparison. For discretionary traders with multi-day trades, period-based stats may differ from trade-level statistics — consistent with how Sharpe, Sortino, and drawdown metrics operate on return periods.
pip install quantstats-pro --upgrade- Python >= 3.10
- pandas >= 1.5.0
- numpy >= 1.24.0
- scipy >= 1.11.0
- matplotlib >= 3.7.0
- seaborn >= 0.13.0
- tabulate >= 0.9.0
- yfinance >= 0.2.40
- arch >= 6.0 (GARCH calibration for Montecarlo)
- plotly >= 5.0.0 (optional, for using
plots.to_plotly())
If you find a bug, please open an issue.
Contributions welcome — check open issues or upstream QuantStats issues for bugs we're tracking.
When saving the monthly returns heatmap via savefig={...}, the figure may still be displayed in addition to being written to disk. Pass show=False explicitly where supported.
QuantStats Pro is a fork of QuantStats by Ran Aroussi, distributed under the Apache Software License. See LICENSE.txt for details.
QuantStats Pro — maintained by Diego Alvarez
QuantStats (original) — Ran Aroussi