Kwirth is the final implementation of the idea of having a simple way to be able to recieve live-streaming observability data from your kubernetes clusters (or even another container orchestrtion systems like Docker or Docker Compose). Maybe you feel comfortable with your DataDog or your Grafana and the Loki and the Promtrail, or any other observability tool for monitoring your kubernetes. But maybe these (and other tools) are too complex for you, it's a common scenario the need for viewing real-time log, metrics, alerts or whatever observability artifact without the need for storing them.
If this is the case, Kwirth is what you need.
Yo can go to Kwirth site if you prefer a user-friendly (non-developer) web interface here for reading Kwirth docs.
Basically, Kwirth receives live streams of observability data that comes from one or more Kubernetes clusters in real-time, and with the data received you can perform several activities depending on your role and your needs.
- Kwirth can be used for detecting exceptional situations (alerts) based on log messages (Alert Channel).
- It can also be used by development teams for viewing real-time logs of the containers deployed to your Kubernetes cluster (Log Channel)
- You can analyze your kubernetes objects performance and resource usage (CPU%, Memory%, bandwith usage, latencies, filesystem access...) using Kwirth provided metrics (Metrics Channel).
- You can analyze your containers secrity posture by using the Trivy Operator inside Kwirth (by adding the Trivy Channel).
- You can perform day-to-day operations like: restarting objectos, shell to objects, send commands, get object information... by using the Kiwrth Ops Channel.
And, specially...:
- You can aggregate all this kind of information form different sources. I mean, for example, you can have on unique live-stream log that consolidates logging information from different sources, i.e., difeferent containers, different pods, different namespaces or even different clusters.
Yes, one only command, just a simple 'kubectl' is enough for deploying Kwirth to your cluster.
kubectl apply -f https://raw.githubusercontent.com/jfvilas/kwirth/master/test/kwirth.yamlIf everything is ok, in no more than 8 to 10 seconds Kwirth should be up and running. So next step is accessing the front application of your fresh new logging system. You can access Kwirth via your Kubernetes management tool, via kubectl-port-forwarding, or even creating an ingress (which is the best way). By default, Kwirth listens on root path at port 3883.
If you have created a port forward by entering...
kubectl port-forward svc/kwirth-svc 3883...you should be able to access Kwirth at http://localhost:3883/.
When you first deploy Kwirth there will exist an admin account. The credentials for the admin account are strong credentials like these:
- User:
admin - Password:
password
Enjoy!!
Kwirth is not Loki nor Grafana, Kwirth is not Elastic, Kwirth is not DataDog, Kwirth is not Azure Log Analytics... Kwirth can perform as much as all of the tasks you can do with these observability tools, but with a fraction of the cost (in terms of money, but also in terms of time and kubernetes resource usage).
Kwirth just shows the right kubernetes information to the user that needs it. In addition, Kwirth sends data in real time, live.streaming all the information the users request.
It is important to understand that Kwirth does not store any logging, metrics or whatever information, it is just a kubernetes data exporting system and analyse tool.
The architecture of Kwirth is the one depicted below.
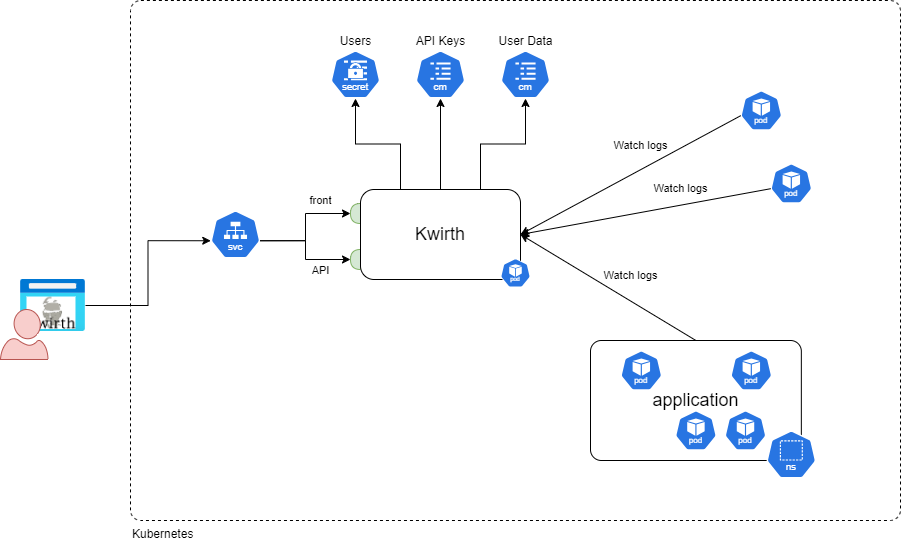
There is only one pod with one only container needed to run Kwirth. Of course, you can create replicas and services and ingresses if you need to scale out, but, generally speaking, Kwirth has no computing needs, since the only function of the pod is extracting kubernetes data and re-sending it to Kwirth clients, wherever it be Kwirth frontend application or any other client like (Backstage Kubelog)[https://www.npmjs.com/package/@jfvilas/plugin-kubelog] or (KwirthLog plugin for Backstage)[https://www.npmjs.com/package/@jfvilas/plugin-kwirth-log].
Each individual Kwirth feature is implemented via a channel. a channel serves, in fact, a secifica type of information. These are currently existing channels:
- Log Channel, for receiving real-time logs of get start diagnostics reviewing start-time logs.
- Metrics Channel, fro viewing real-time metrics on your selected objects (CPU%, memory%, I/O, etc.). Please note that Kwirth doesn't need Prometheus for getting data, Kwirth implements its own metric-gathering system by accesing directly the cAdvisor running on your nodes' Kubelets.
- Alert Channel, for receiving reall-tiem alerts on specific log messages (or regexes matched on log messages).
- Ops Channel, for performing container operations like restart or shell.
- Trivy Channel, for reviewing the cybersecurity risks associated to your Kubernetes objects (based on Trivy Operator).
Each individual channel can be activated/deactivated on Kwirth Core.