This package is a Backstage plugin for showing real-time streamed Kubernetes objects' metrics and perform some basic pod operations via Kwirth.
KwirthMetrics is compatible with Kwirth core server versions according to following table.
| Plugin Kwirth version | Kwirth version |
|---|---|
| 0.13.0 | 0.4.131 |
| 0.12.8 | 0.4.45 |
| 0.12.5 | 0.4.20 |
This Backstage plugin allows you viewing Kubernetes metrics in real time that are linked to your Backstage entities. It's very important to understand that for this plugin to work you need to install Kwirth on your Kubernetes cluster (aside from Kwirth Backstage backend plugin), that is, this plugin is just another frontend for Kwirth.
In this very first versoin of KwirthMetrics you will be able to perform at least this actions:
- Show real-time metrics of a source container (you can select which containers to view)
- Show real-time metrics of a source pod (including all its containers)
- Show real-time metrics of a set of pods (you can select what pods to chart)
- Restarting a kubernetes object (pod, set of pods or just a simple container). This capability is not designed to substitute your operation tools, it is just a way for your developers, for example, to self-solve restarting-pod needs without the complexity of giving them access to Lens, K9s, Headlamp or kubectl.
Kwirth is a really-easy-to-use data-exporting platform for Kubernetes that runs in only one pod (no database is needed). Refer to Kwirth GitHub project for info on installation. Kwirth installation is one command away from you!!.
In addition, you can access Kwirth project here.
This Backstage plugin adds Backstage a feature for showing real-time charts showing of metrics about your Kubernetes objects and its resource consumption.You can show this charts directly inside your Backstage frontend application. The plugin will be enabled for any entity that is correctly tagged (according to Backstage Kubernetes core feature) and its correpsonding Kubernetes resources are found on any of the clusters that have been added to Backstage.
In addition, Backstage users can restart pods if they are allowed to (according to KwirthMetrics and KwirthOps permissions).
When KwirthMetrics is correctly installed and configured, it is possible to stream and chart real-time Kubernetes metrics to your Backstage like in this sample we show here:
This frontend plugin includes just the visualization of metrics charts. All needed configuration, and specially all permission settings are done in the backend plugin and the app-config YAML. You can restrict access to pods, namespaces, clusters, etc. by configuring permissions to be applied by the backend plugin.
The ability to restart pods is also configured in the app-config (YAML, env or whatever), and restartig permissions are set independently than chart streaming permissions. The backend plugin is the only responsible for configuration and permissionism, all the capabilities related with showing charts are implemented in the frontend plugin, which is in charge of establishing the connections to the corresponding Kwirth instances (running inside your Kubernetes clusters).
Let's explain this by following a user working sequence:
- A Backstage user searchs for an entity in the Backstage.
- In the entity page there will be a new tab named 'KWIRTHMETRICS'.
- When the user clicks on KWIRTHMETRICS the frontend plugin sends a request to the backend plugin asking for metrics information on several Kubernetes clusters.
- Next step is to identify the Kubernetes objects that match requested entity. As well as it occurs with other Backstage Kwirth plugins, Kwirth implements two strategies for getting the listo of kubernetes objects that match:
- Option 1. Your catalog-info contains an annotation of this type: backstage.io/kubernetes-id. In this case, the Backstage Kwirth backend plugin sends requests to the Kwirth instances that are running inside all the clusters previously added to Backstage (via app-config YAML). These requests ask for the following: 'Tell me all the pods that are labeled with the kubernetes-id label and do correspond with the entity I'm looking for'. In response to this query, each Kwirth instance answers with a list of pods and the namespaces where they are running.
- Option 2. Your catalog-info contains an annotation of this type: backstage.io/kubernetes-label-selector. In this case, the Backstage Kwirth backend plugin sends requests to the Kwirth instances that are running inside all the clusters previously added to Backstage (via app-config YAML). These requests ask for the following: 'Tell me all the pods whose labels match with the kubernetes-label-selector label selector. In response to this query, each Kwirth instance answers with a list of pods and the namespaces where they are running.
- The backend plugin checks the permissions of the connected user and prunes the pods list removing the ones that the user has not access to.
- With the final pod list, the backend plugin sends requests to the Kwirth instances on the clusters asking for specific API Keys for streaming metrics and/or restarting Kubernetes objects.
- The backend plugin then asks for a metrics list, that is, a list of the metrics the Kubernetes cluster can offer (the ones managed by the kubelet)
- With all this information, the backend builds a unique response containing all the pods the user have access to, all the API keys needed to access (wherever it be streaming metrics information for charting or pod-restarting) those pods, and all the metrics available at each cluster.
If everyting is correctly configured and tagged, the user should see a list of clusters similar to the one we show bellow. When selecting a cluster, the user should see a list of namespaces where the entity is running and is elligible for showing metrics charts.
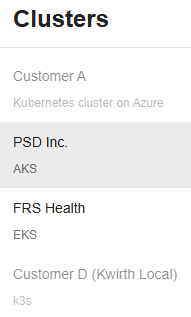
-
Install corresponding Backstage backend plugin more information here. The backend plugin of Kwirth is shared with all front end plugins, so you only need to install backend plugin once.
-
Install this KwirthMetrics Backstage frontend plugin:
# From your Backstage root directory yarn --cwd packages/app add @jfvilas/plugin-kwirth-metrics @jfvilas/plugin-kwirth-common @jfvilas/plugin-kwirth-frontend @jfvilas/kwirth-common -
Make sure the Kwirth backend plugin is installed and configured.
-
Restart your Backstage instance.
Firstly, import the plugin module.
// In packages/app/src/components/catalog/EntityPage.tsx
import { EntityKwirthMetricsContent, isKwirthAvailable } from '@jfvilas/plugin-kwirth-metrics';
Then, add a tab to your EntityPage (the 'if' is optional, you can keep the 'KwirthMetrics' tab always visible if you prefer to do it that way).
// Note: Add to any other Pages as well (e.g. defaultEntityPage or webSiteEntityPage, for example)
const serviceEntityPage = (
  <EntityLayout>
    {/* other tabs... */}
    <EntityLayout.Route if={isKwirthAvailable} path="/kwirthmetrics" title="KwirthMetrics">
      <EntityKwirthMetricsContent allMetrics={true} enableRestart={false} />
    </EntityLayout.Route>
  </EntityLayout>
)
You can setup some default viewing options on the EntityKwirthMetricsContent component, so, when the entity loads the default options will be set. These options are:
- depth
- width
- interval
- chart
(The meaning of these properties are explained at the end of this document)
If you want to setup a long-running histogram as a default chart for your entities you should setup your entity page like this:
  ...
  <EntityLayout.Route if={isKwirthAvailable} path="/kwirthmetrics" title="KwirthMetrics">
    <EntityKwirthMetricsContent allMetrics={true} enableRestart={false} depth={100} chart={'bar'}/>
  </EntityLayout.Route>
  ...
You can also set some behaviour options for the plugin:
hideVersion(optionalboolean) if set totrue, version information updates will not be shown.excludeContainers(optionalstring[]), an array of container names that will be excluded from visualization. For example, if you have pods that include sidecars, you can exclude sidecard log messages using this property. What follows is an example on how to use these properties:defaultMetrics(optionalboolean) if set totrue, version information updates will not be shown.
  ...
  <EntityLayout.Route if={isKwirthAvailable} path="/kwirthlog" title="KwirthLog">
    <EntityKwirthLogContent hideVersion excludeContainers={['istio-proxy', 'nginx']} defaultMetrics={['kwirth_container_cpu_percentage', 'kwirth_container_memory_percentage']} />
  </EntityLayout.Route>
...Use one of these startegies:
-
Strategy 1: one-to-one. Add
backstage.io/kubernetes-idannotation to yourcatalog-info.yamlfor the entities deployed to Kubernetes you want to work with on Backstage. This is the same annotation that the Kubernetes core plugin uses, so, maybe you already have added it to your components. Exmaple:metadata: annotations: backstage.io/kubernetes-id: entity001
-
Strategy 2: use selectors. Add
backstage.io/kubernetes-label-selectorannotation to yourcatalog-info.yamlfor the entities you want to work with. This is the same annotation that the Kubernetes core plugin uses, so, maybe you already have added it to your components. The label selector value follows Kubernetes label selector semantics. Example:metadata: annotations: backstage.io/kubernetes-id: 'app=core,artifact=backend'
- Add proper labels to your Kubernetes objects so Backstage can link forward and backward the Backstage entities with the Kubernetes objects. To do this, you need to add
labelsto your Kubernetes YAML objects (please, don't get confused: annotations in Backstage YAML, labels in Kubernetes YAML).
-
VERY IMPORTANT NOTE: If you opted for using label selectors you have nothing new to add to your pods.
-
If you use labels (no label selectors), please note that the kubernetes-id label is on the deployment and on the spec pod template also. This is an example of a typical Kubernetes deployment with the required label:
apiVersion: apps/v1
kind: Deployment
metadata:
  name: ijkl
  labels:
    backstage.io/kubernetes-id: ijkl
spec:
  selector:
    matchLabels:
      app: ijkl
  template:
    metadata:
      name: 'ijkl-pod'
      labels:
        app: ijkl
        backstage.io/kubernetes-id: ijkl
    spec:
      containers:
        - name: ijkl
          image: your-OCI-image
    ...
If you performed all these steps you would see a 'KwirthMetrics' tab in your Entity Page, like this one:
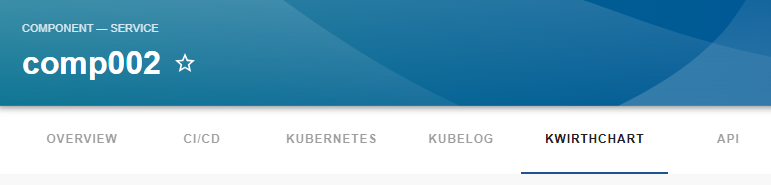
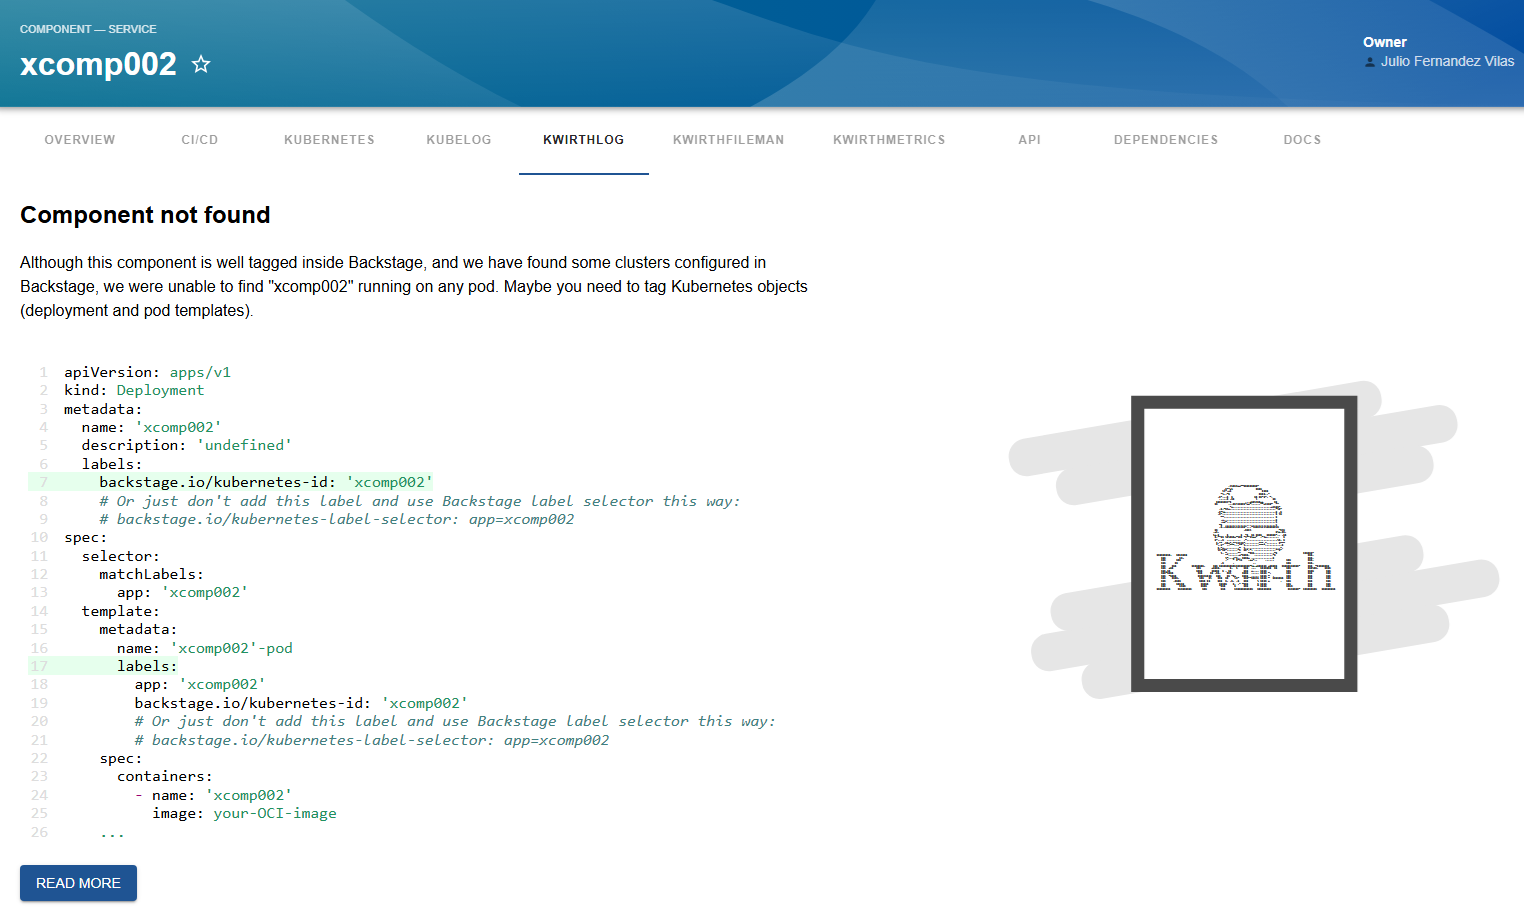
When you access the tab, if you have not yet tagged your entities you would see a message like this one explaning how to do that:
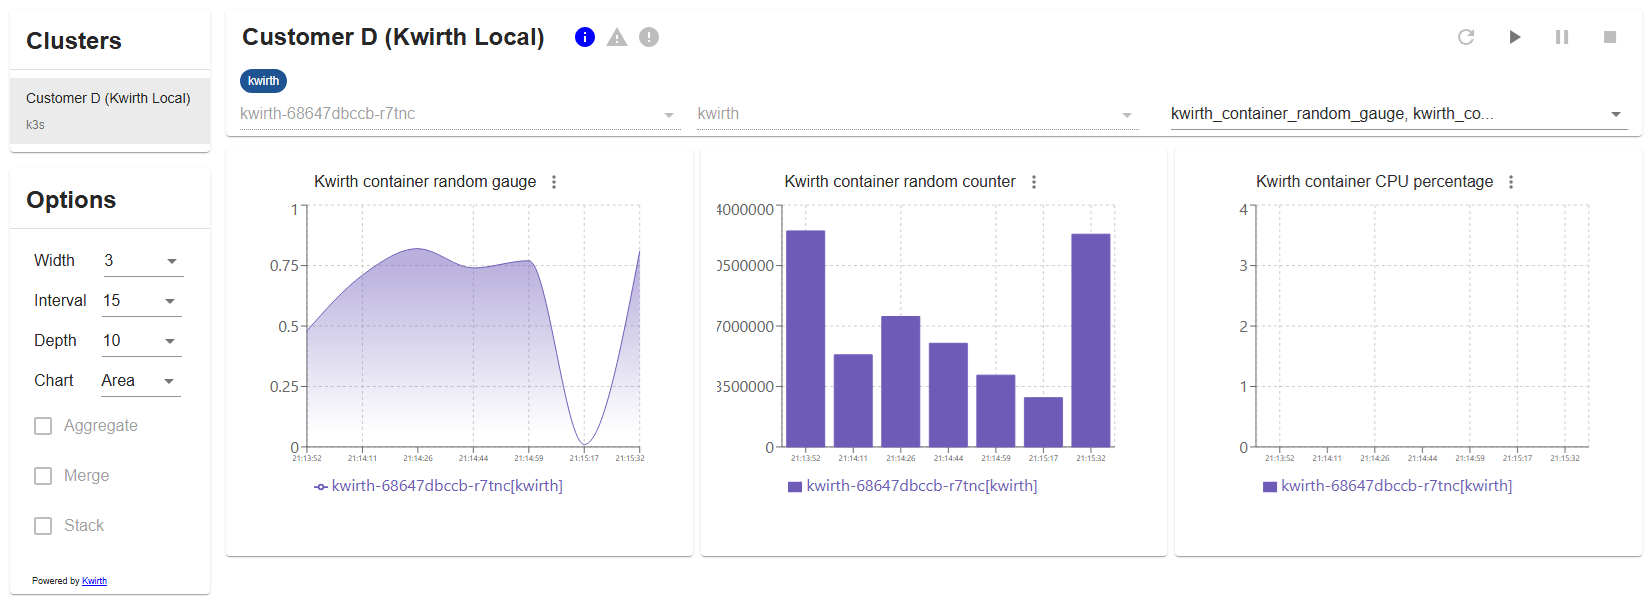
Once you tag your entities and your Kubernetes objects, you should see something similar to this:
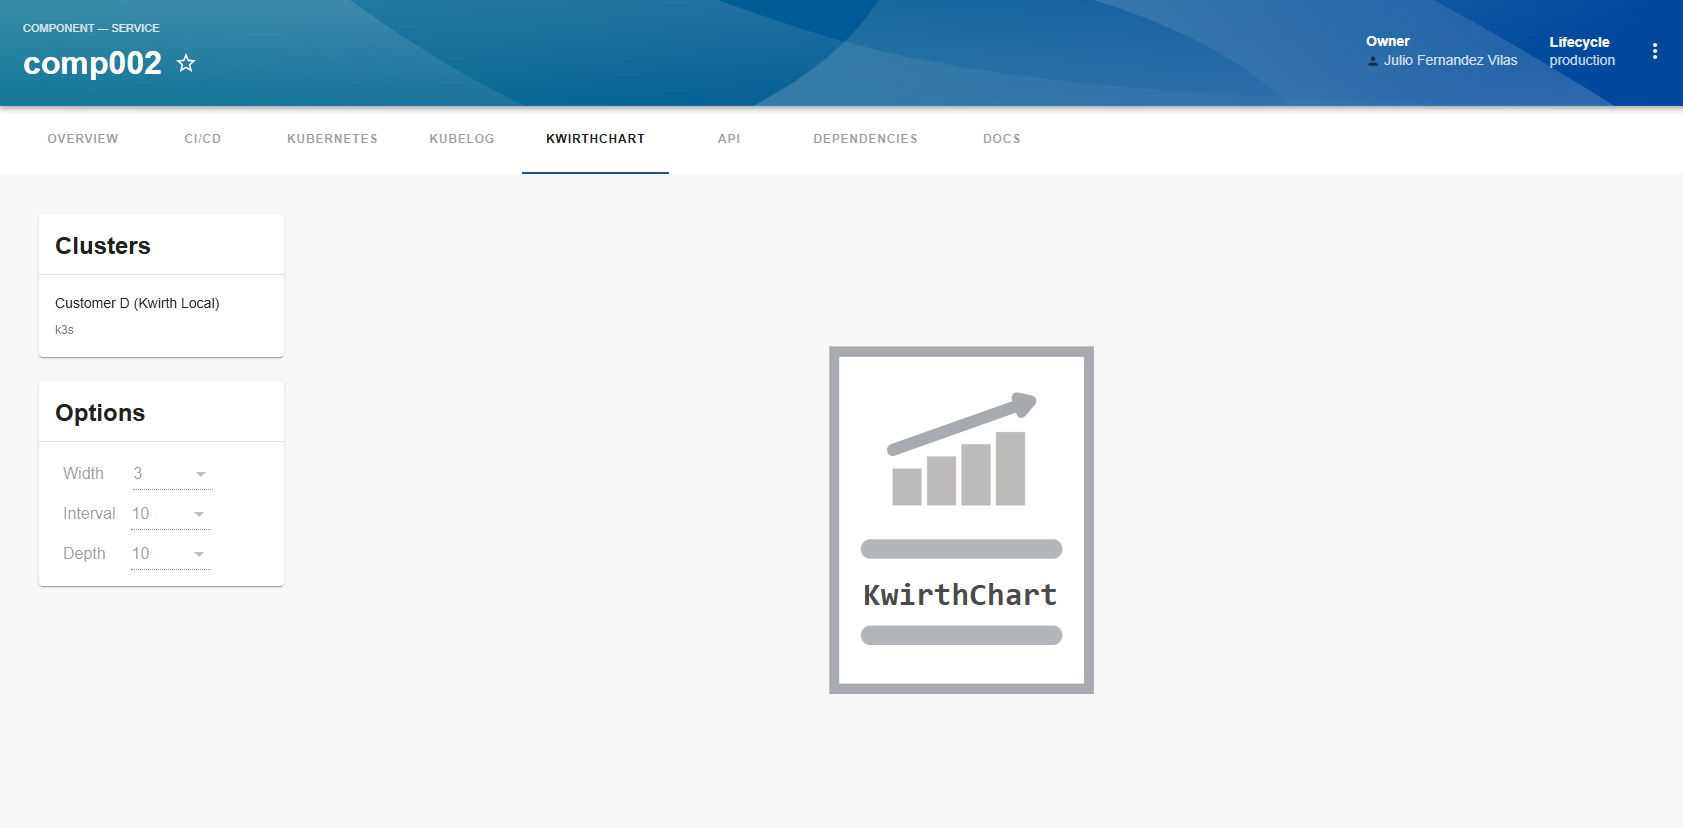
KwirthMetrics is ready to show your favourite charts!!
Just select the cluster on the cluster card and eventually set the options you want for the charts (we will explain them later). On the new card that will appear on right, you will see all the Kubernetes namespaces available and a control section (restart, play, pause and stop). Select a namespace, click PLAY button and your charts will start to show in real-time.
Feel free to open issues and ask for more features.
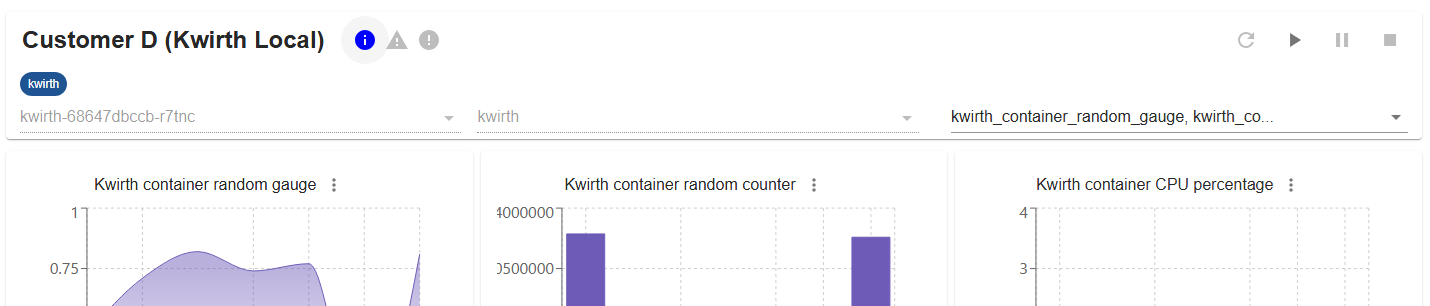
When the metrics stream starts, and all along the life of the stream (until it gets stopped or the window is closed), you will receive status information regarding the pods and containers you are watching. This status information is shown on the top of the card (just at the immediate right of the cluster name) including 3 kinds of information:
- Info. Information regarding pod management at Kubernetes cluster level (new pod, pod ended or pod modified).
- Warning. Warnings related to the metrics stream.
- Error. If there is an error in the stream, like invalid key use, or erroneous pod tagging, errors will be shown here.
The icons will light up in its corresponding color when a new event takes place.
This is how it feels:
If your Backstage administrator has configured Restarting permissions and you are permitted, you would see a "Restart Pod" button just on the left of the "Play" button.
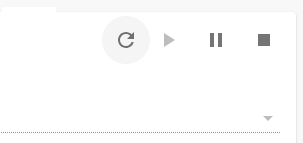
When you are not allowed to restart a pod, you can see the icon but you cannot click it. Conversely, if you are allowed, you can click the button and the pod (in the namespace you have selected) will be restarted.
Please take into account that you may be allowed in one namespace but not in another one, or you may be allowed to restart pods on a cluster but not on another one. The restart icon will be enabled or disabled according to your pod, namespace and cluster permissions.
Please rememebr, "Pod restarting" is an optional feature that must be configured in two different points:
- At the app-config YAML, enabling/disabling the feature and adding restrictions (pod, namespace, cluster...)
- At the EntityPage, adding a property to KwithMetrics component that enables or disables restarting. If restarting is disabled on front component, the restarting icon will not appear.
Let's see an example.
You must edit the EntityPage page and modify your EntityKwirthMetricsContent for adding the "enableRestart" property as shown in following example:
// Note: Add to any other Pages as well (e.g. defaultEntityPage or webSiteEntityPage, for example)
const serviceEntityPage = (
  <EntityLayout>

    {/* other tabs... */}

    <EntityLayout.Route if={isKwirthAvailable} path="/kwirthmetrics" title="KwirthMetrics">
      <EntityKwirthMetricsContent enableRestart={true}/>
    </EntityLayout.Route>
  </EntityLayout>
)Restarting capabilities are always present in Backstage Kwirth Backend plugin, but they must be enabled (and permsssioned if needed) by tailoring your app-config file. Object restarting permissions works exactly the same as metrics-streaming or log-viewing permissions (namespace permission, pod permissions, and a set of allow/deny/except/unless rules). The only difference is the specific part of the app-config where restarting permissions must be set.
The following example shows a simple sample containing:
- Metrics streaming permissions for charting in all namespaces for all users.
- Pod restarting permissions enabled only for admins in 'production' namespace.
kubernetes:
  serviceLocatorMethod:
    type: 'multiTenant'
  clusterLocatorMethods:
    - type: 'config'
      clusters:
        - name: Customer D (Kwirth Local)
          title: 'k3s'
          url: https://host.docker.internal:64506
          kwirthHome: http://localhost/kwirth
          kwirthApiKey: '144892e3-aa8d-4b15-a5ab-fd3789721ebe|permanent|cluster::::'
          kwirthmetrics:
            namespacePermissions:
            podPermissions:
          kwirthops:
            namespacePermissions:
              - production: ['group:default/administrators']
As you can see:
- There are no namespace nor pod restrictions for streaming metrics data ('kwirthmetrics' section)
- Operations permissions ('ops' channel, 'kwirthops' section) is restricted to group 'administrators' fro namespace 'production', and is free for the rest of users and goups.
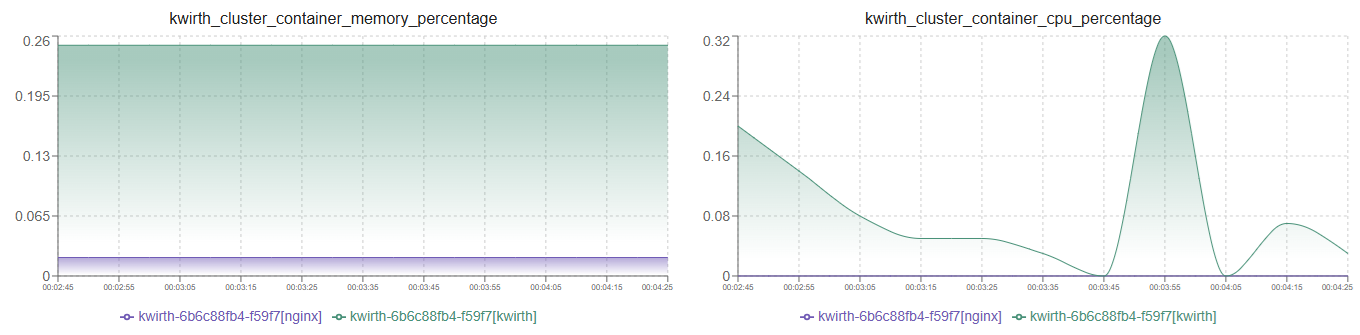
The charting system implemented in KwirthMetrics has some configuration options whose meaning is explained below.
Set the number of charts you want to be shown on each line. If you have selected more than one asset (pod, container...), each asset will start showing charts on a new line, so KwirthMetrics will adjust each asset's charts to end on a whole line. For example, let's suppose you select 2 pods and select 4 metrics for each pod:
- If you set width to 4, you will see two lines, each line containing 4 charts (one for each metric), each line showing charts for each pod.
- If you set width to 3, you will see 4 lines:
- First line will contain first 3 metrics of first pod.
- Second line will show the last metric of firt pod.
- Third line will contain first 3 metrics of second pod.
- Fourth line will contain last metric of second pod.
- If you set width to a number larger than the number of selected metrics it will have no impact: the number of charts per line will be the number of selected metrics.
Number of seconds between samples. Take into account that this interval is not the real cluster metrics smple rate, which must be set inside Kwirth core for each cluster.
Number of values to hold on screen.
Select the cart type to use:
- Value chart, shows a number with the last read value.
- Line chart, shows a line chart with 'depth' values.
- Area chart, shows an area chart with 'depth' values.
- Bar chart, shows a bar chart chart with 'depth' values.
When you select more than one asset, and the chart type is set to Bar or Area, you can decide how to manage metrics that come from different sources:
- Aggregte, values of different sources will be added up, no matter the chart type you've selected.
- Merge, values of differnte sources (same metric but different source object) will be shonw in the same chart.
- Stack, if you've selected 'merge', you can decide to show stacked original values, or just show a sum of all the values on each sample.
Please check the examples below to understand how each one of these will behave:
Aggregate
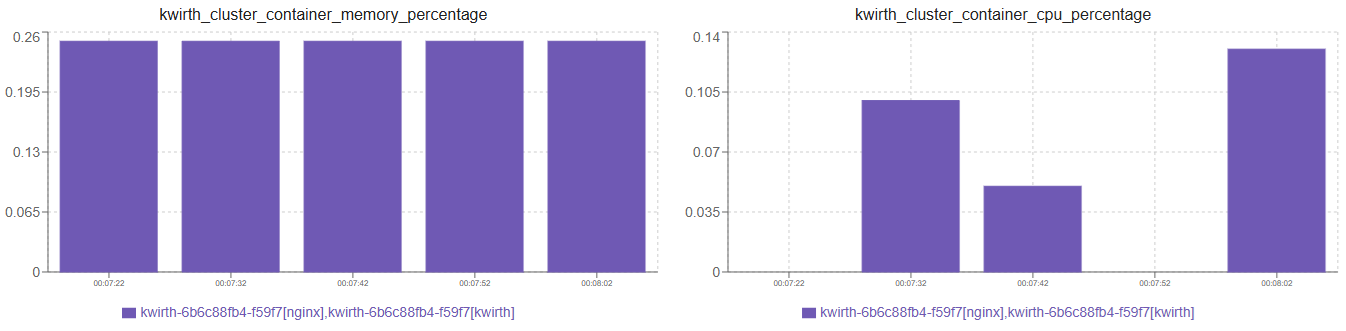
Merge
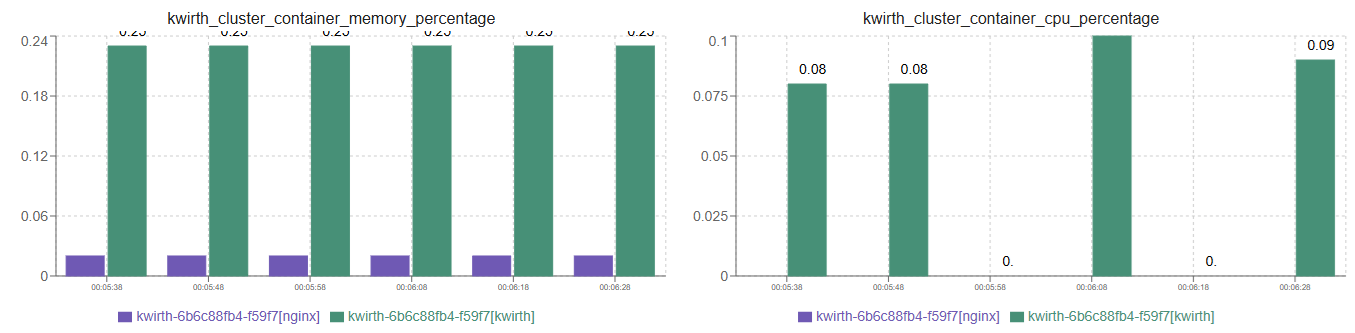
Merge and Stack