


This project explores how AR can enhance data visualization, allowing users to intuitively explore and interact with 3D Graphs in the real-world environment. It was featured by the datavizsociety https://www.instagram.com/reel/CtX26g5rqYA/?utm_source=ig_web_copy_link
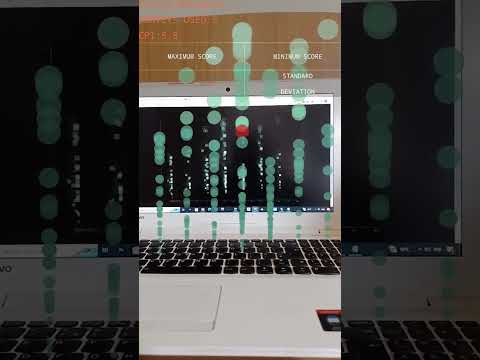
- 📐 3D Scatterplot Rendering: Prototype includes depth, color, and size to represent multiple dimensions of data.
- 🕹️ Basic Interaction: View and navigate scatterplots in AR to explore data spatially.
- 🌍 Meta Spark Integration: Leverages the power of Meta Spark AR Studio to create engaging and accessible AR experiences.
- ⚡ Dataset Compatibility & Flexibility: Tested with small datasets for prototyping and experimentation.