This is a gem in two acts:
When the gem is added to a rails app, it begins to log information on each request. Specifically, it logs the size of the process and the Active Record instantiation breakdown care of active-record-instance-count.
The logs look like this:
[2016-03-14 19:04:56 +0100]  INFO --: [Memory Usage] PID: 10730 Project: nil User: nil Mem: 179752.0 Records: (110 | User: 39 | Asset: 24 | Pic: 20 | Playlist: 6 | Track: 5 | Comment: 5 | Forum: 3 | Topic: 3 | Post: 3 | Update: 2); /
[2016-03-14 18:47:16 +0100]  INFO --: [Memory Usage] PID: 9815 Project: nil User: 1 Mem: 297224.0 Records: (103 | Asset: 29 | Pic: 21 | User: 16 | Playlist: 15 | Listen: 10 | Track: 5 | Comment: 5 | Update: 2); /sudara
Adding this gem to your Gemfile will immediately change your rails logging output:
gem 'rails_memory_bloat'The logger requires the active-record-instance-count gem to gather Active Record information. It also depends on the GetProcessMem to either efficiently grab memory info from /proc/#{pid}/status (or resort to shelling out to ps)
The gem also contains an executable to parse the rails logs generated by the gem.
The executable calls out to gnuplot and requires that you have it installed.
On osx: brew install gnuplot --with-x11 --with-cairo
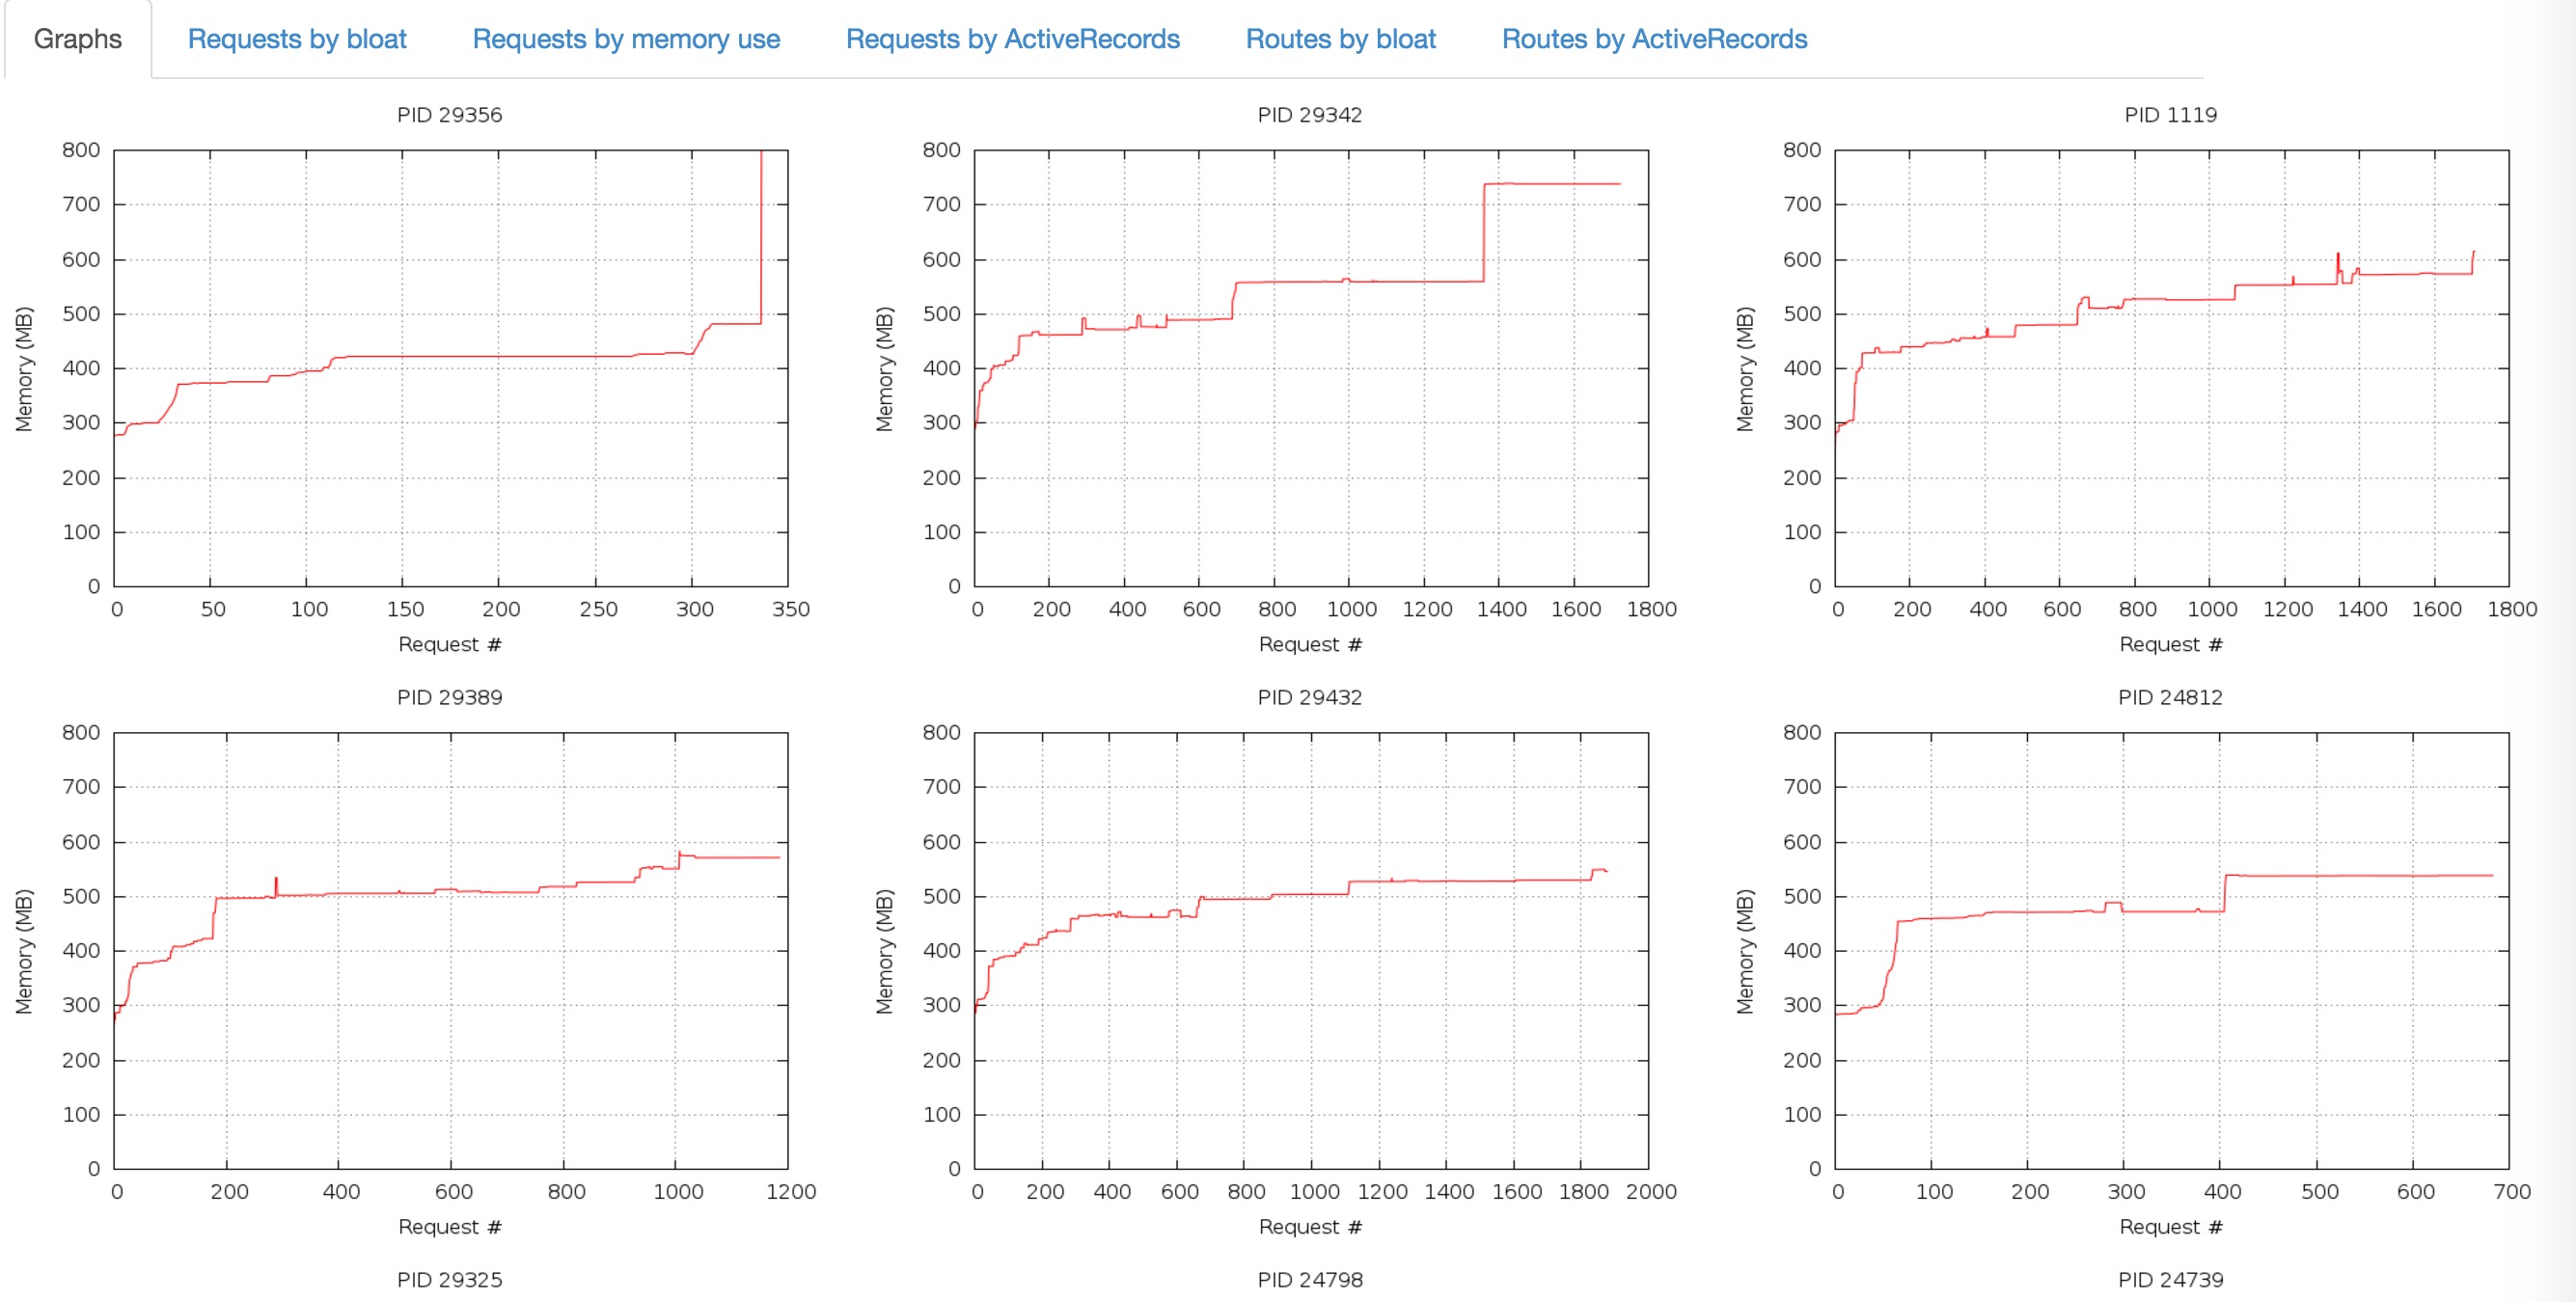
An html page is created, containing graphical and tabular representations of the process size over time.
To generate the report run:
bundle exec build_memory_report
This will output some html and assets in a folder called output
We run this code in production, but only for a few hours on one server. The goal is to grab a good set of live production logs.
In our measurements, 10-20ms of time is added by grabbing the PID and memory info, which we consider unacceptable for constant use in production.
See zombocom/get_process_mem#15
Bump lib/rails_memory_bloat/version.rb and gem build rails_memory_bloat.gemspec